Database Work Without Dashboards 2.0: What We’ve Learned From Teams That Actually Did It

Dashboards used to be the safety blanket.
If something looked off, you opened a wall of charts, clicked through a few panels, and hoped the picture would tell you what happened.
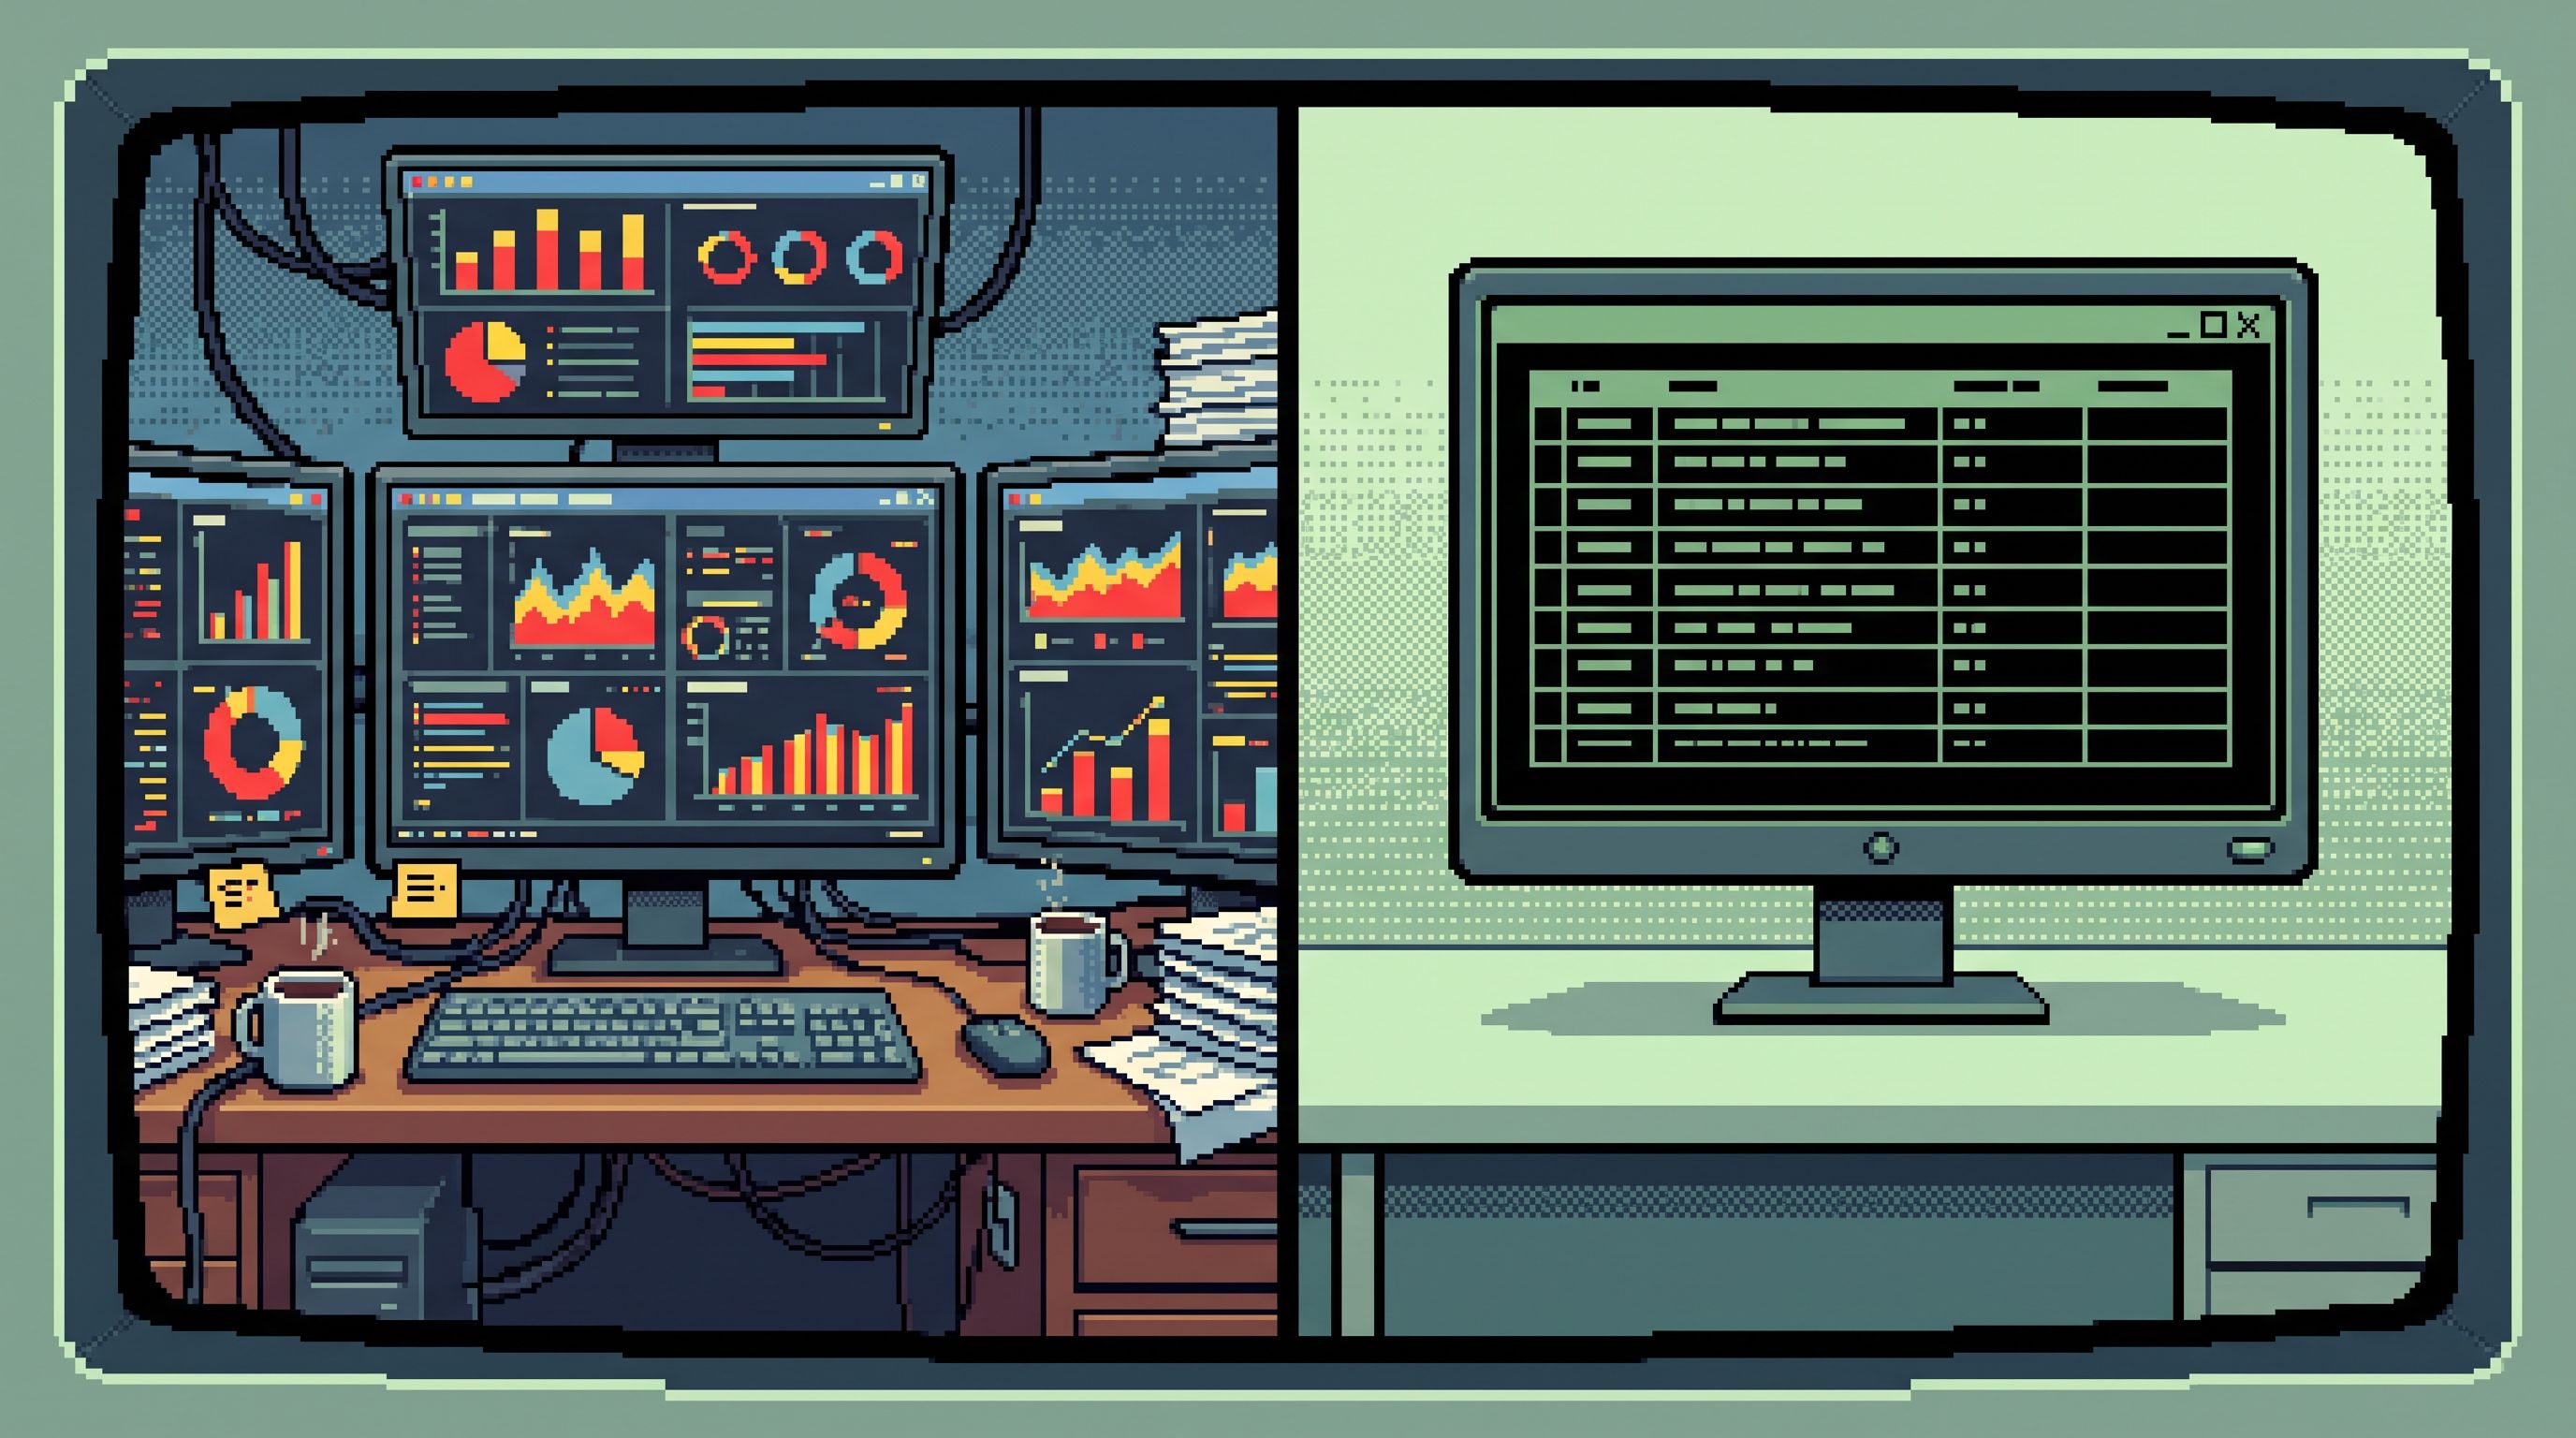
Over the last couple of years, more teams have tried a different posture: database work without dashboards as the primary surface. Charts still exist, but they’re background radiation, not the main event. The real work happens on rows, in a calm, opinionated browser like Simpl.
This post is about what we’ve seen from teams that didn’t just talk about this pattern — they actually shipped it, ran incidents on it, and onboarded new engineers into it.
What changed. What broke. What got dramatically quieter.
Why this shift matters
When teams de‑center dashboards and move work into rows, three things happen quickly:
-
Incidents resolve with clearer stories.
- Instead of “latency spiked around 14:00,” you get “these 37 invoices retried three times because the payment provider timed out.”
- People remember explanations, not chart shapes.
-
On‑call feels less like channel surfing.
- You move from alert → a small set of focused queries → explanation.
- Fewer tools open. Fewer contradictory views of the same problem.
- If this resonates, you’ll probably like the pattern in Post-Dashboard On‑Call: Running Incidents From Rows, Not Charts.
-
Support and product can safely self‑serve.
- They don’t need a BI playground or admin console to answer concrete questions.
- A calm, read‑only browser like Simpl gives them a narrow, reliable path from “this user is confused” to “here are the exact rows that explain it.”
The benefit is not less data. It’s less noise around the data.
What “without dashboards” actually looks like in practice
Teams that made this work didn’t just delete Grafana and hope for the best. They made a few specific, opinionated moves.
1. Dashboards move to the edge of the loop
Dashboards are still around, but they’re no longer where the work happens.
Most teams we’ve seen settle into a simple pattern:
- Use dashboards to notice that something is wrong.
- Error rate, latency, signups, revenue — they’re good for “something changed.”
- Use rows to understand what actually happened.
- Concrete questions always end on specific users, jobs, invoices, or events.
The shift is subtle but important:
Dashboards become entry points, not workspaces.
Instead of building more and more panels for every edge case, teams invest in one strong path from signal → rows. Tools like Simpl sit in that path as the calm surface where the explanation is assembled.
If you want a deeper dive into that loop, The Calm Debug Loop: Running Incidents From One Question Instead of Ten Tools is a good companion read.
Five lessons from teams that actually shipped this
1. You have to pick a primary surface
The teams that succeeded chose one place where real work happens.
That surface had a few consistent traits:
- Read‑first, often read‑only.
- No schema edits. No wide UPDATEs. No one‑click “fix” buttons.
- Everyday work is about understanding, not mutating.
- Opinionated navigation.
- Start from intent: a user ID, an invoice number, a job ID.
- Land on the relevant tables and rows without wandering the schema tree.
- This is the same idea we unpacked in Beyond Object Trees: Intent‑First Navigation Patterns for Modern Database Browsers.
- Minimal query surface.
- Enough SQL to express filters and joins.
- Guardrails that make risky shapes hard to even think about.
For many teams, that surface was Simpl:
- A calm browser for production reads.
- A place where support, product, and engineering can share the same view of reality.
- A clear line between “I’m reading to understand” and “I’m editing to change the system.”
The important part isn’t which tool you pick. It’s that you pick one, and design your workflows around it.
2. You need a narrative, not a playground
Dashboards encourage grazing.
You open a panel, click around a few charts, add a temporary filter, and hope the pattern jumps out. It’s easy to lose the thread.
Teams that moved away from dashboards leaned into narrative instead of playground:
- Every debug or support session starts from one concrete question.
- “Why did this user’s invoice change yesterday?”
- “Which jobs failed in the last hour for this tenant?”
- The primary surface keeps a linear trail of what you looked at.
- Queries, filters, and pivots feel like steps in a story.
- You can hand that story to someone else later.
Patterns that helped:
- Single‑intent sessions.
- One question. One main query or small set of related reads.
- No tab zoo, no ten half‑finished CTEs.
- This is the heart of The Single-Intent SQL Session: Writing One Query That Answers the Real Question.
- Saved walkthroughs instead of saved dashboards.
- Teams save “how we debug X” as a short sequence of queries and filters.
- Those walkthroughs become the new runbooks.
From Data Wandering to Data Walkthroughs: Structuring Calm Narratives for Debug Sessions goes deeper into how to structure those stories.
3. Guardrails matter more than training
A surprising lesson: you can’t train your way out of risky reads.
Teams that tried to replace dashboards with a full‑power SQL editor in production ran into familiar problems:
- A wide
SELECT *over a hot table during peak traffic. - An unbounded scan from a support query.
- A join that quietly fans out across tenants.
The teams that made the “no dashboards” posture stick did something different:
- Guardrails in the browser itself.
- Pagination that defaults to time‑ordered, cursor‑based views.
- Opinionated filters instead of arbitrary WHERE clauses for common paths.
- Warnings or hard stops on obviously dangerous patterns.
- Safer defaults for common questions.
- Pre‑built, parameterized views for “user timeline,” “invoice lifecycle,” “job history.”
- People fill in IDs, not write ad‑hoc queries from scratch.
This is where an opinionated browser like Simpl shines:
- It’s designed around production reads, not experimentation.
- Features like calm pagination and constrained filters make it hard to accidentally hammer the database.
- Patterns from posts like The Calm Query Cliff: Designing Browsers That Make Risky SQL Hard to Even Think About and Opinionated Filters, Not Free-Form Search: Calmer Patterns for Narrowing Production Data show up as defaults, not guidelines.
Training still matters. But the surface should do most of the work.
4. On‑call shifts get quieter, but only if you redesign them
You can’t just remove dashboards from on‑call and hope the pager feels better.
Teams that succeeded rewrote their on‑call playbooks around a row‑first loop:
- Alert fires.
- You still glance at a chart to confirm the signal.
- Jump straight into a focused view in your browser.
- A link from the alert to a pre‑filtered table in Simpl.
- For example: “recent failed jobs for this service,” “recent invoices with status X,” “recent 5xx responses for this route.”
- Stay in one surface until you have a story.
- Move between related tables (jobs → attempts → users) without changing tools.
- Write down the narrative as you go.
- Only then fan out to other systems.
- Logs, traces, feature flags — all in service of the row‑level story.
The result:
- Fewer tools open at once.
- Less time spent reconciling which dashboard is “right.”
- Easier handoffs between shifts, because the story lives in one place.
Teams that paired this with patterns from The Quiet Data Handoff: Passing Production Context Between Shifts Without Dashboards or Docs Sprawl saw the biggest gains:
- Night shift leaves a short trail of queries and notes.
- Morning shift can replay the exact path, not just re‑open the same charts.
5. Onboarding gets narrower, and that’s a feature
New engineers used to be onboarded with:
- Access to the warehouse.
- Links to a dozen dashboards.
- A schema doc that’s out of date by the time they read it.
Teams that moved to a row‑first posture changed the shape of onboarding entirely:
- One primary tool on day one.
- Usually Simpl or an equivalent browser.
- New hires learn how to answer real questions with rows, not how to configure charts.
- Single‑question exercises.
- “Find everything that happened to this user in the last 24 hours.”
- “Explain why this invoice looks the way it does.”
- “Trace this job from creation to completion.”
- No dashboards in the first week.
- Charts come later, as supporting context, not the main skill.
This narrower path does two things:
- It builds trust in the primary surface.
- It makes sure people learn how to read production data before they learn how to decorate it.
For a deeper pattern here, see The Single-Question Onboarding: Teaching New Engineers Production Data Without Overwhelming Them.
Common failure modes (and how teams corrected them)
Even teams that are committed to this posture stumble in a few predictable ways.
Failure mode 1: “We just turned off dashboards”
Turning dashboards off without redesigning workflows usually leads to:
- People quietly rebuilding them in notebooks or ad‑hoc tools.
- Frustration when simple questions feel harder than before.
Correction:
- Keep a small set of coarse dashboards for signals.
- Make it trivial to jump from those signals into your primary browser with the right filters already applied.
Failure mode 2: “We replaced dashboards with a warehouse IDE”
Giving everyone a full SQL playground against production is not an upgrade.
Correction:
- Introduce a calm, constrained browser in front of the warehouse or primary database.
- Reserve the IDE for deeper analysis and offline work.
- Use patterns from The Minimalist Data IDE: Where Simpl Ends and Your Editor Should Begin to draw that line.
Failure mode 3: “Every team builds their own views”
If every squad creates their own version of “user timeline” or “invoice history,” you’re back in dashboard sprawl, just with tables instead of charts.
Correction:
- Standardize a small library of canonical views in your browser.
- Make them parameterized and shareable.
- Treat new views as part of your product, not personal scratchpads.
A simple place to start
If you want to move toward database work without dashboards as the primary surface, you don’t need a big migration plan.
You can start with one area of the product and one question:
-
Pick a high‑leverage workflow.
- On‑call for a specific service.
- Billing or subscription support.
- A noisy feature that generates a lot of tickets.
-
Define the top 3 questions people ask there.
- “Which customers were affected by this incident?”
- “What happened to this invoice?”
- “Why did this job get stuck?”
-
Build row‑first paths for those questions in a calm browser.
- Use Simpl or your equivalent as the primary surface.
- Add opinionated filters, safe defaults, and clear navigation.
-
Wire alerts and tickets into those paths.
- Links from alerts go to rows, not dashboards.
- Support tickets include direct links to the relevant views.
-
Run one incident or support week on this new path.
- Observe how often people need to fall back to dashboards.
- Tighten the browser and views until the fallback rate drops.
Once that loop feels good for one area, you can copy it elsewhere.
Summary
Teams that actually shipped “database work without dashboards” didn’t go tool‑minimalist for its own sake. They:
- Chose a primary, calm surface for production reads — often Simpl.
- Pushed dashboards to the edge of the loop, keeping them for signals, not explanations.
- Redesigned workflows (on‑call, support, onboarding) around rows and narratives, not panels and tiles.
- Invested in guardrails and opinionated defaults inside the browser instead of relying on training alone.
- Standardized a small library of canonical views instead of letting every team rebuild their own mini‑dashboard stack.
The payoff is quiet but real:
- Clearer incident stories.
- Safer, more focused production reads.
- On‑call and support that feel linear instead of scattered.
Take the first step
If this resonates, don’t start by deleting dashboards.
Start by choosing one question and one surface.
Pick a real workflow — a noisy support path, a flaky job queue, a sensitive billing flow — and make a deliberate decision:
From now on, we answer this question from rows, in one calm browser, with a clear narrative trail.
If you want a tool built for exactly that kind of work, explore how Simpl can sit at the center of your stack as the opinionated browser for production reads.
One question. One surface. Then another.
That’s Database Work Without Dashboards 2.0 in practice.