Post-Dashboard On‑Call: Running Incidents From Rows, Not Charts


On‑call used to mean dashboards.
An alert would fire, and the first instinct was to open a wall of charts: latency, error rate, throughput, CPU, cache hit ratio. You’d scan shapes and colors, squint at a few annotations, and then—eventually—drop into the database to see what actually happened.
That “eventually” is the problem.
Most incidents end the same way: someone explains a story about specific users, jobs, or invoices. That story is always grounded in rows, not charts.
This post is an argument for a post‑dashboard posture for on‑call:
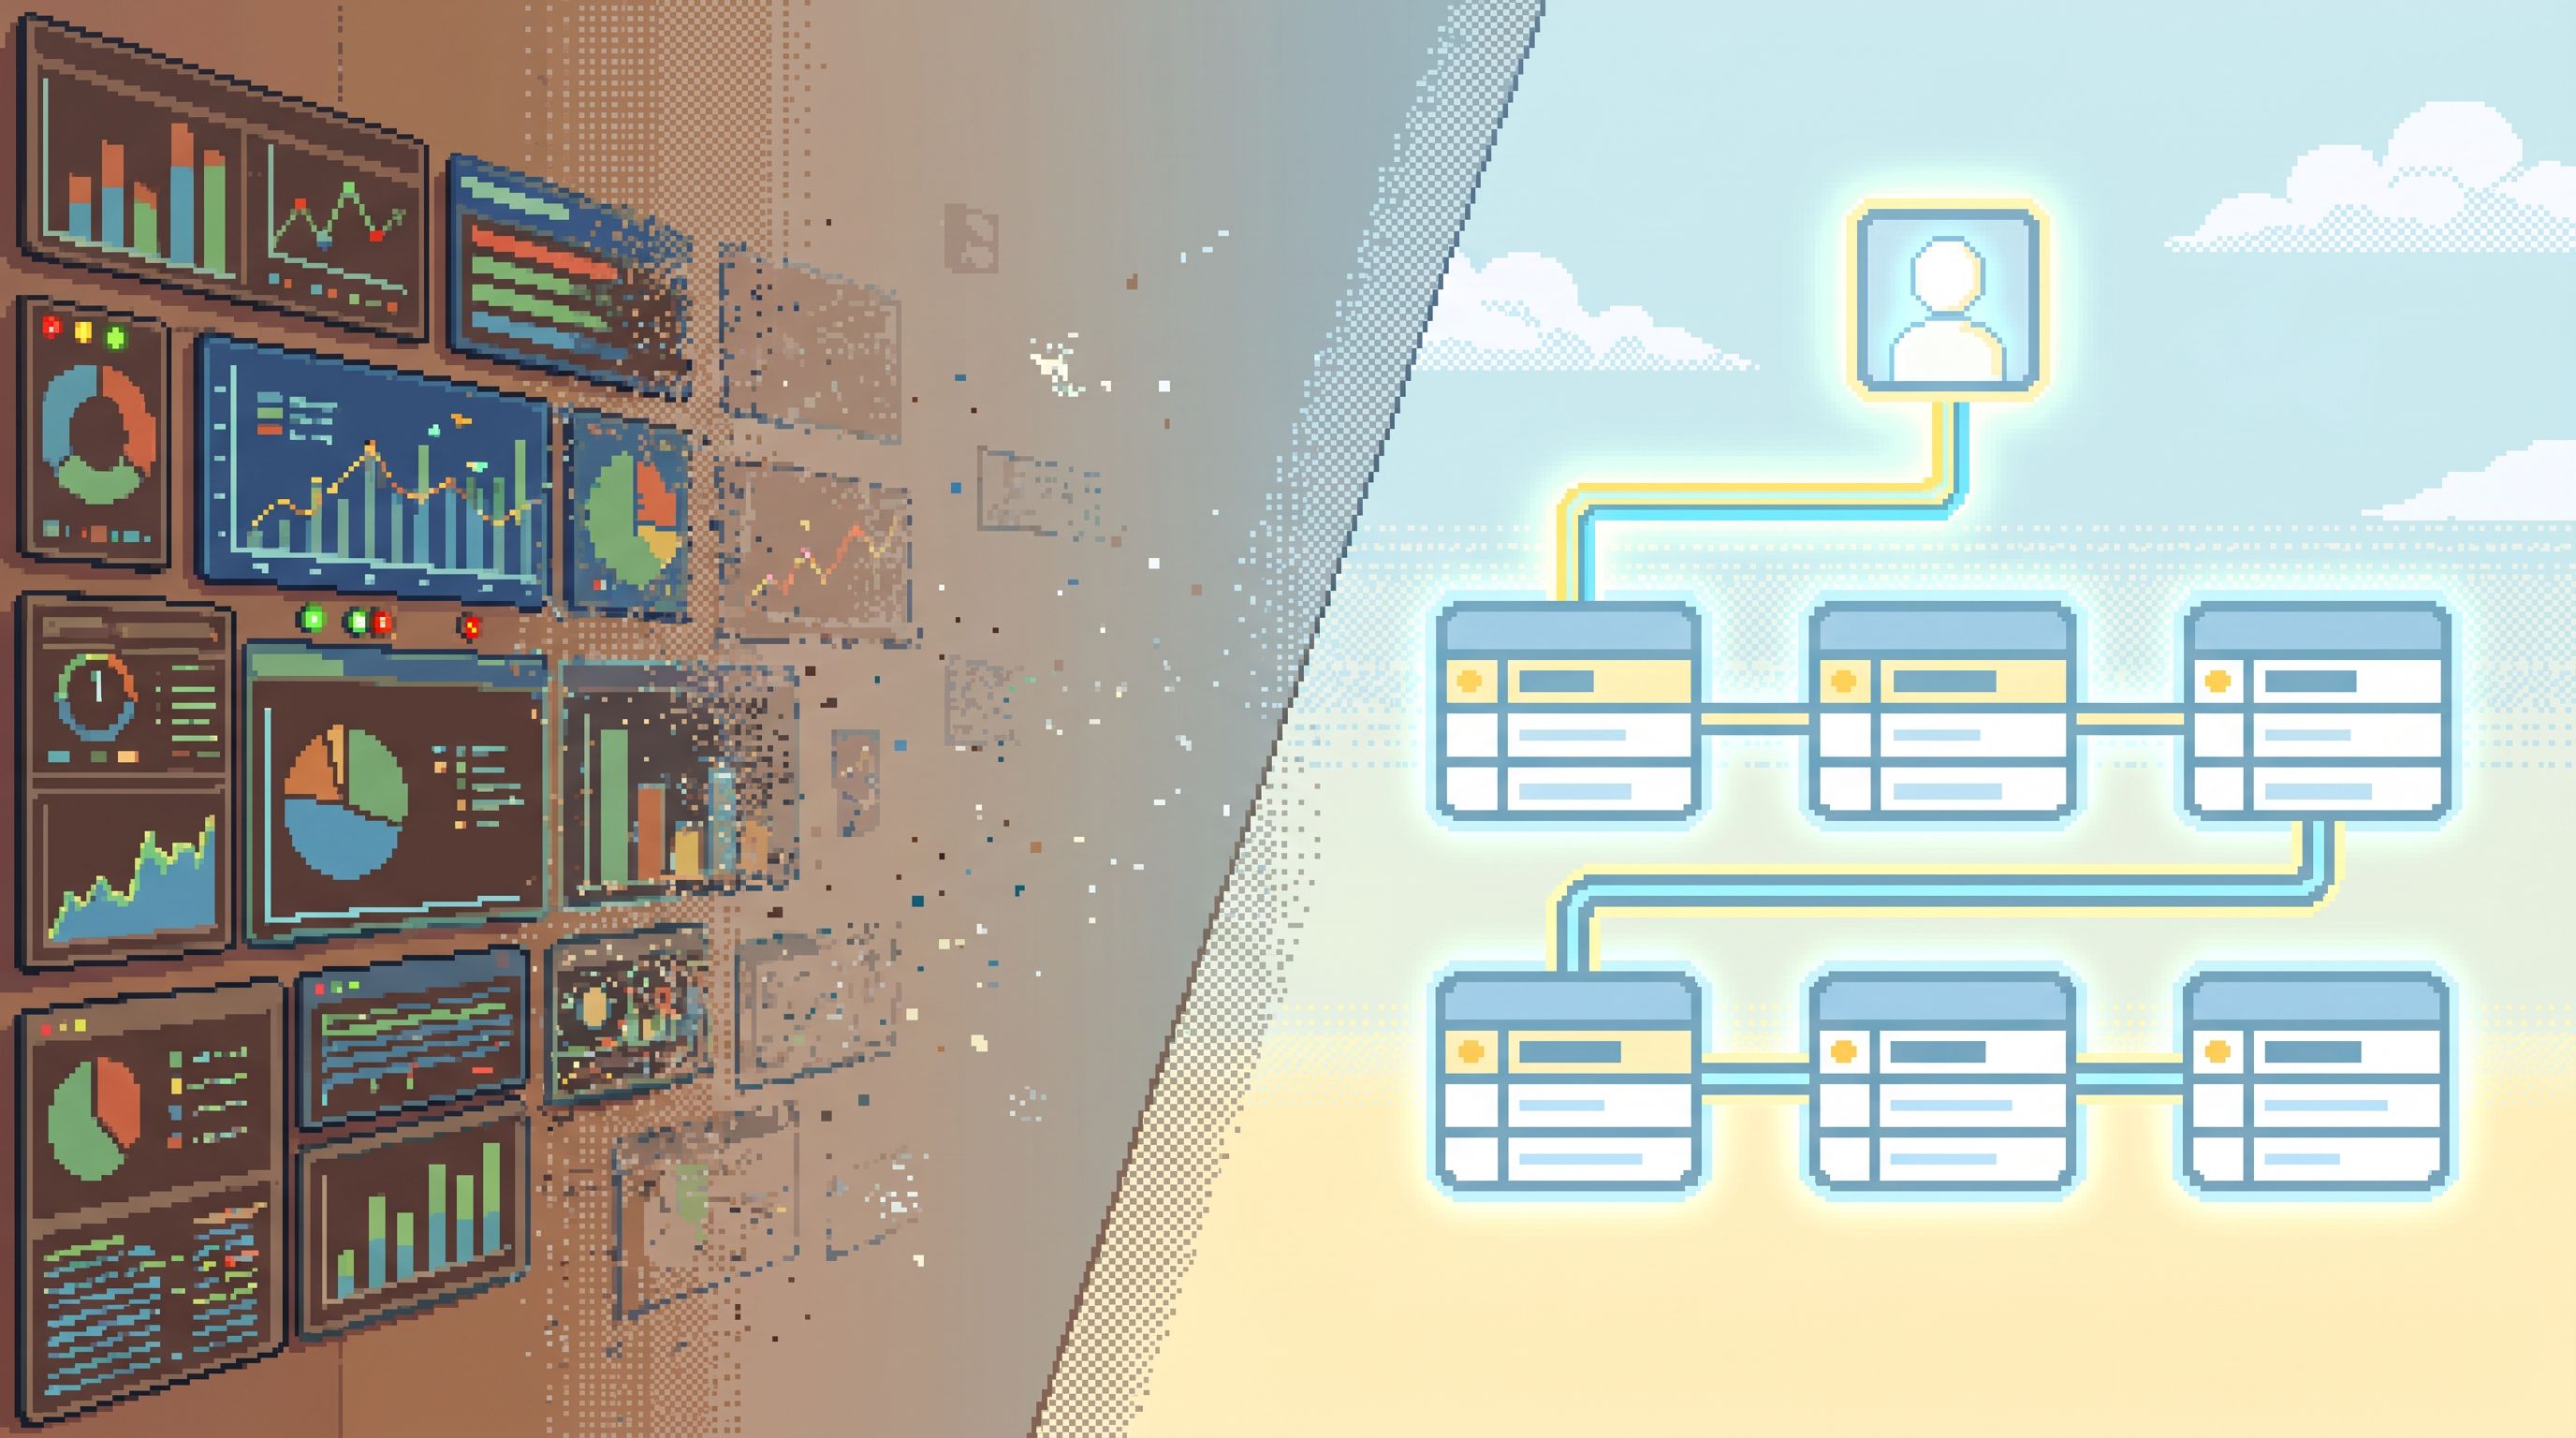
Run incidents from rows first, and let charts play a supporting role.
Tools like Simpl exist because this shift is overdue: an opinionated database browser that assumes the center of gravity for incident work is concrete records, not a gallery of visualizations.
Why rows beat charts when you’re on‑call
Dashboards are good at answering one kind of question:
“Is something broadly wrong?”
They are much worse at answering the questions you actually debate on incident calls:
- Which users are impacted?
- What shape does the bad data take?
- When did the first bad row appear, and what changed right before it?
- Is this a replayable pattern or a one‑off corruption?
Those are row‑level questions. You can’t really see them in a 5‑minute p95 latency chart.
A post‑dashboard on‑call posture has a few clear advantages:
-
Faster path to the real story
Instead of staring at a red line and guessing, you jump straight to the users, jobs, or entities that actually broke. -
Less speculative debate
Charts invite theory: “Maybe it’s the new index?” “Could be a regional spike.” Rows invite inspection: “Every failed job hasstatus = 'queued'butstarted_atis null.” -
Better handoffs and retros
It’s easier to share a narrative built from a small set of coherent queries than a screenshot collage of half‑understood panels. (If this resonates, you might like From Tables to Stories: Turning Production Reads into Sharable Debug Narratives.) -
Safer, calmer operations
When your primary surface is a read‑focused browser like Simpl, you’re less likely to reach for ad‑hoc, risky SQL in a panic.
The goal isn’t to delete every dashboard. It’s to move the center of gravity: charts for detection and coarse orientation, rows for explanation and decision‑making.
The core shift: from metrics question to entity question
Most on‑call flows start with a metrics question:
“Why did error rate spike at 10:07?”
A post‑dashboard flow rephrases that immediately as an entity question:
“Which entities were failing at 10:07, and what did their rows look like?”
Entities might be:
- Users
- Tenants / accounts
- Jobs or tasks
- Orders / invoices / payments
- Feature flag evaluations
Once you’re thinking in entities, the incident loop becomes:
- Identify a representative entity (or a small set of them).
- Read its rows across key tables along a narrow path.
- Compare good vs bad entities on that same path.
- Explain the difference in plain language.
You can still glance at charts. But they’re there to help you pick which entities to read, not to carry the full weight of the investigation.
If you’ve read The Calm Incident Loop: Designing One Reusable Path From Alert to Row and Back, this will feel familiar. Post‑dashboard on‑call is basically that loop, but with a stronger bias: you don’t consider the incident “understood” until you can point at specific rows.
Designing a row‑first incident loop
Let’s make this concrete.
Imagine a typical alert: “Payment failures above baseline for the last 10 minutes.” In a dashboard‑first world, you’d open a payments dashboard, scan a few panels, maybe drill into a chart by country or card brand.
In a row‑first world, the loop looks more like this:
-
Pick one canonical entry point
This might be an alert payload, a log line, or a trace. The goal: extract a concrete identifier (user ID, job ID, invoice ID). -
Jump directly to that entity’s rows
In Simpl, that means:- Open the relevant table (e.g.,
paymentsorpayment_attempts). - Filter by the primary key or a stable business ID.
- Land on a single row as your starting point.
- Open the relevant table (e.g.,
-
Follow a narrow, opinionated path
From that row, you follow a pre‑agreed path of related tables—orders, invoices, subscriptions, feature flags—using foreign keys or known relationships. (This is where patterns from Focused Reads at Scale: Keeping Production Debugging Calm When You Have 500+ Tables pay off.) -
Compare good vs bad
Pull up:- One entity that failed.
- One entity that succeeded right before or after. Then line up their rows and ask: What is structurally different?
-
Translate into a narrative
Once you see the pattern in rows, you can explain:- Who is affected
- Since when
- Under what conditions
- What a safe fix might look like
-
Only then, zoom out to charts
Use dashboards to validate the scope: does the narrative you built from rows match the shape of the metric spike? If not, your story is incomplete.
This loop is simple on purpose. The hard part is enforcing it under pressure.

Opinionated constraints that make row‑first work
Row‑first on‑call isn’t just a mindset. It depends on a few opinionated constraints in your tools and habits.
1. One primary surface for reading rows
If every incident devolves into “open the SQL IDE,” you’ll end up with:
- Ad‑hoc queries under pressure
- Risky verbs (
UPDATE,DELETE) in the same place you debug - Fragmented context across tabs and terminals
A calmer pattern:
- Use an opinionated database browser like Simpl as the default incident surface.
- Keep it read‑first by design: no destructive verbs, no schema‑wide search that invites wild joins.
- Treat full‑power SQL as an escalation path, not the first move.
This is the same stance behind The Post-Playground SQL Editor: Why Less Freedom Makes Production Debugging Safer: less freedom during incidents, more safety, and better focus.
2. Pre‑baked entry points, not free‑form exploration
On‑call is not the time to “explore the schema.” You want:
- Saved entry queries like:
SELECT * FROM payments WHERE id = :payment_idSELECT * FROM jobs WHERE id = :job_idSELECT * FROM users WHERE id = :user_id
- Shortcuts from alerts/logs into those entry points.
The key is that these queries:
- Are parameterized (you only fill in the ID).
- Return at most a handful of rows.
- Are named by intent, not by table.
For example:
Inspect single payment attemptInspect user’s active subscriptionInspect job execution trail
When an alert fires, on‑call should be able to:
- Copy an ID from the alert payload.
- Paste it into a named query in Simpl.
- Land on a single, stable row.
3. Calm pagination and time travel
Incidents often hinge on when something changed, not just what it is now.
To keep that work linear:
- Use cursor‑based pagination that follows a clear ordering (usually time).
- Prefer opinionated time travel over ad‑hoc
created_atfilters.
Concretely:
- For a user’s invoices, page by
issued_at DESC, not arbitrary offsets. - For jobs, anchor on
enqueued_atorstarted_atand move forward/backward. - For historical states, use tooling that can show “row as of timestamp” instead of forcing you to reconstruct history with manual filters.
If this feels fuzzy, The Calm Cursor: Pagination Patterns That Keep Production Debugging Linear and Opinionated Time Travel: Calm Patterns for Reading Historical States in Production Data go much deeper.
4. Minimalist, safe query patterns
When you do need to write or edit SQL during an incident, the patterns should be constrained by default.
A few practical constraints:
- No
SELECT *on hot tables in your incident surface. - Always filter by a primary or unique key first.
- Limit row counts aggressively (e.g.,
LIMIT 50). - Prefer simple, single‑intent queries over clever joins.
These are the same habits outlined in The Minimalist Query Habit: Five Small Constraints That Make Production Reads Safer. They matter even more when adrenaline is high.
In Simpl, many of these constraints can be baked into the UI:
- Column pickers instead of
SELECT * - Opinionated filters instead of free‑form
WHERE - Guardrails that make risky shapes of SQL hard to even formulate
A concrete example: turning a payments spike into rows
Let’s walk through a simplified, row‑first incident.
Alert: payment_failures_rate > 2x baseline for 5 minutes
Step 1: Extract an ID from the alert
Your alert payload or logs include recent failed payment IDs:
{
  "payment_id": "pay_9f2a...",
  "user_id": "user_183...",
  "error_code": "card_declined",
  "created_at": "2026-07-07T10:07:13Z"
}
Pick one payment_id.
Step 2: Jump to the payment row
In Simpl, run your saved "Inspect single payment attempt" query with that ID.
You land on a row like:
| id | user_id | status | error_code | amount | created_at | |----------|-----------|----------|----------------|--------|---------------------------| | pay_9f2a | user_183 | failed | card_declined | 1200 | 2026-07-07T10:07:13Z |
Step 3: Follow the incident path
From that row, you follow links to:
- User (
userstable) - Invoice (
invoicestable) - Subscription (
subscriptionstable)
You notice:
- The user is in
country = BR. - The invoice is in
currency = BRL. - The subscription was just upgraded, and a new tax rule applied.
Step 4: Compare good vs bad
You grab a successful payment from the same 10‑minute window, same country, similar amount.
Side‑by‑side, the rows show:
- Successful payments use a legacy tax calculation path (
tax_version = v1). - Failed payments use a new path (
tax_version = v2) that slightly over‑charges.
Card declines are legitimate: the bank is rejecting the higher amount.
Step 5: Form the narrative
You can now say, concretely:
- Who is affected: BR customers with upgraded subscriptions.
- Since when: Since deploy X at 10:02 UTC.
- What went wrong: A new tax calculation path over‑charges by ~3%, leading to real card declines.
- What to do now: Roll back the tax path or gate it behind a feature flag for BR until fixed.
Charts might have hinted at a regional spike. But the confidence comes from rows.
Making this real for your team
Shifting to post‑dashboard on‑call is less about adding a new tool and more about removing ambiguity from how incidents run.
Here’s a practical way to start.
1. Declare a primary incident surface
- Pick one place where incident work “lives.”
If you already use Simpl, make it the default surface for reading production rows. - During incidents, treat other tools (dashboards, log search, IDEs) as supporting, not primary.
2. Define 5–10 canonical incident paths
For your most common incident types (payments, signups, jobs, notifications), define:
- The entry entity (user, job, invoice, etc.).
- The tables you usually touch.
- The order you tend to read them in.
Turn each into:
- A saved query or view for the entry entity.
- A small set of pre‑wired navigations between related tables.
3. Bake constraints into the browser
Wherever possible, move safety and focus into the tool:
- Disable or strongly discourage
SELECT *on hot paths. - Keep destructive verbs out of the incident surface entirely.
- Use opinionated filters instead of free‑form search.
Patterns from Opinionated Filters, Not Free‑Form Search: Calmer Patterns for Narrowing Production Data are especially helpful here.
4. Run a “single‑surface” incident drill
Pick a past incident and re‑run it with a constraint:
- Only use your primary row browser (e.g., Simpl) for the core investigation.
- Allow dashboards/logs only to:
- Confirm that something is wrong.
- Validate your final narrative.
Notice where you’re tempted to leave rows for charts. That’s usually a sign of:
- Missing entry points
- Weak navigation between related tables
- Unclear ownership of certain data domains
5. Capture the story as queries, not screenshots
When the incident is over, save:
- The key entity IDs you investigated.
- The exact queries or views that told the story.
- A short written narrative that ties them together.
Over time, this builds a library of replayable debug stories grounded in rows, not one‑off dashboard snapshots.
Summary
Post‑dashboard on‑call is a simple shift with big consequences:
-
Charts for detection, rows for explanation.
Dashboards tell you that something is wrong. Rows tell you what actually happened. -
Entities first, metrics second.
Start from a concrete user, job, or invoice ID and follow a narrow path across tables. -
One calm surface for incident work.
Use an opinionated browser like Simpl as the place where you actually debug, with guardrails that keep queries safe and focused. -
Opinionated patterns over improvisation.
Pre‑baked entry points, calm pagination, time travel, and minimalist query habits make row‑first incident work repeatable instead of heroic.
When incidents are grounded in rows, not charts, you get fewer speculative debates, clearer narratives, and calmer on‑call shifts. The system stops feeling like a set of noisy graphs and starts feeling like what it really is: a collection of concrete stories encoded in data.
Take the first step
You don’t have to redesign your entire incident process to benefit from this posture.
Pick one small move:
- Choose a single incident type—payments, jobs, signups.
- Define one canonical entry query for that entity.
- Wire it into a calm, read‑only surface like Simpl.
- The next time an alert fires in that area, start from that query instead of a dashboard.
Run one incident from rows, not charts.
Notice how it feels.
Then make that feeling the default, not the exception.