The Post-Workspace Browser: Database Debugging Without Tabs, Tiles, or Timelines

Most database debugging sessions don’t fail because the data is missing. They fail because the workspace is.
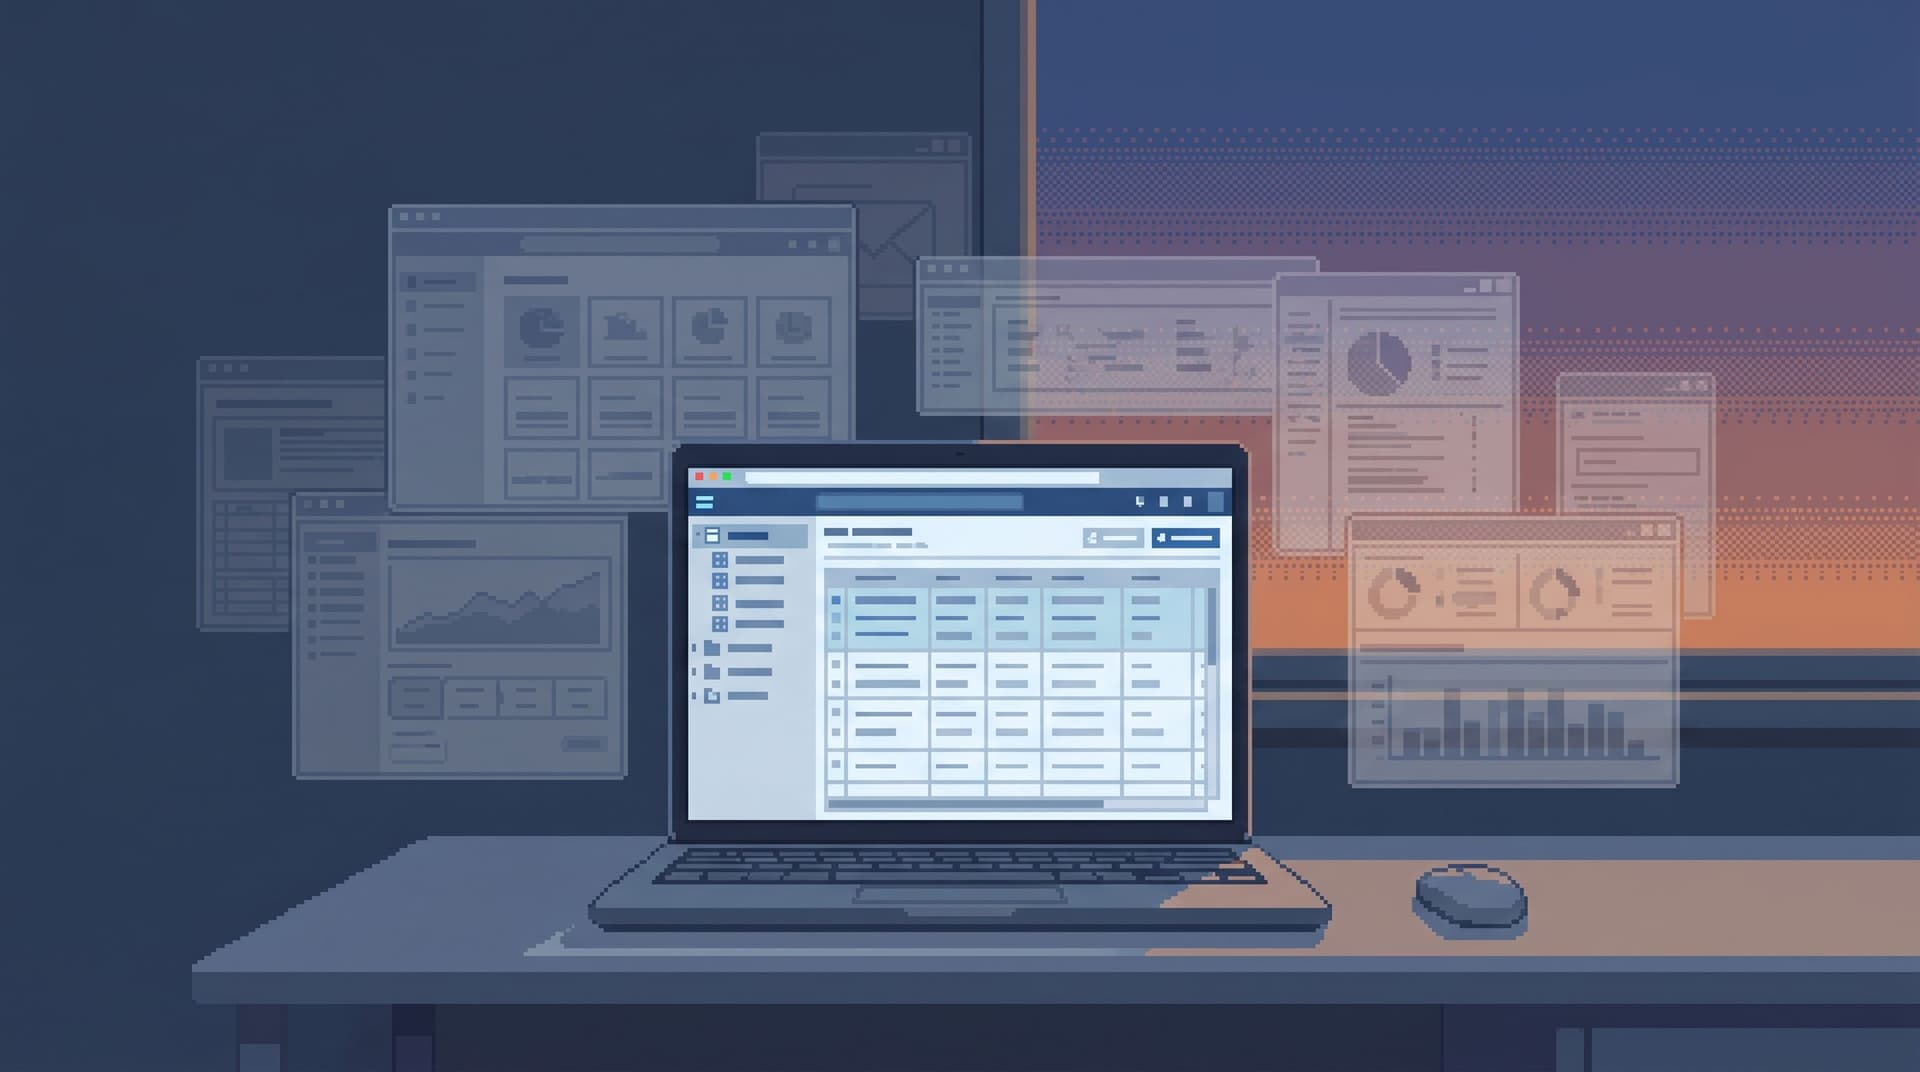
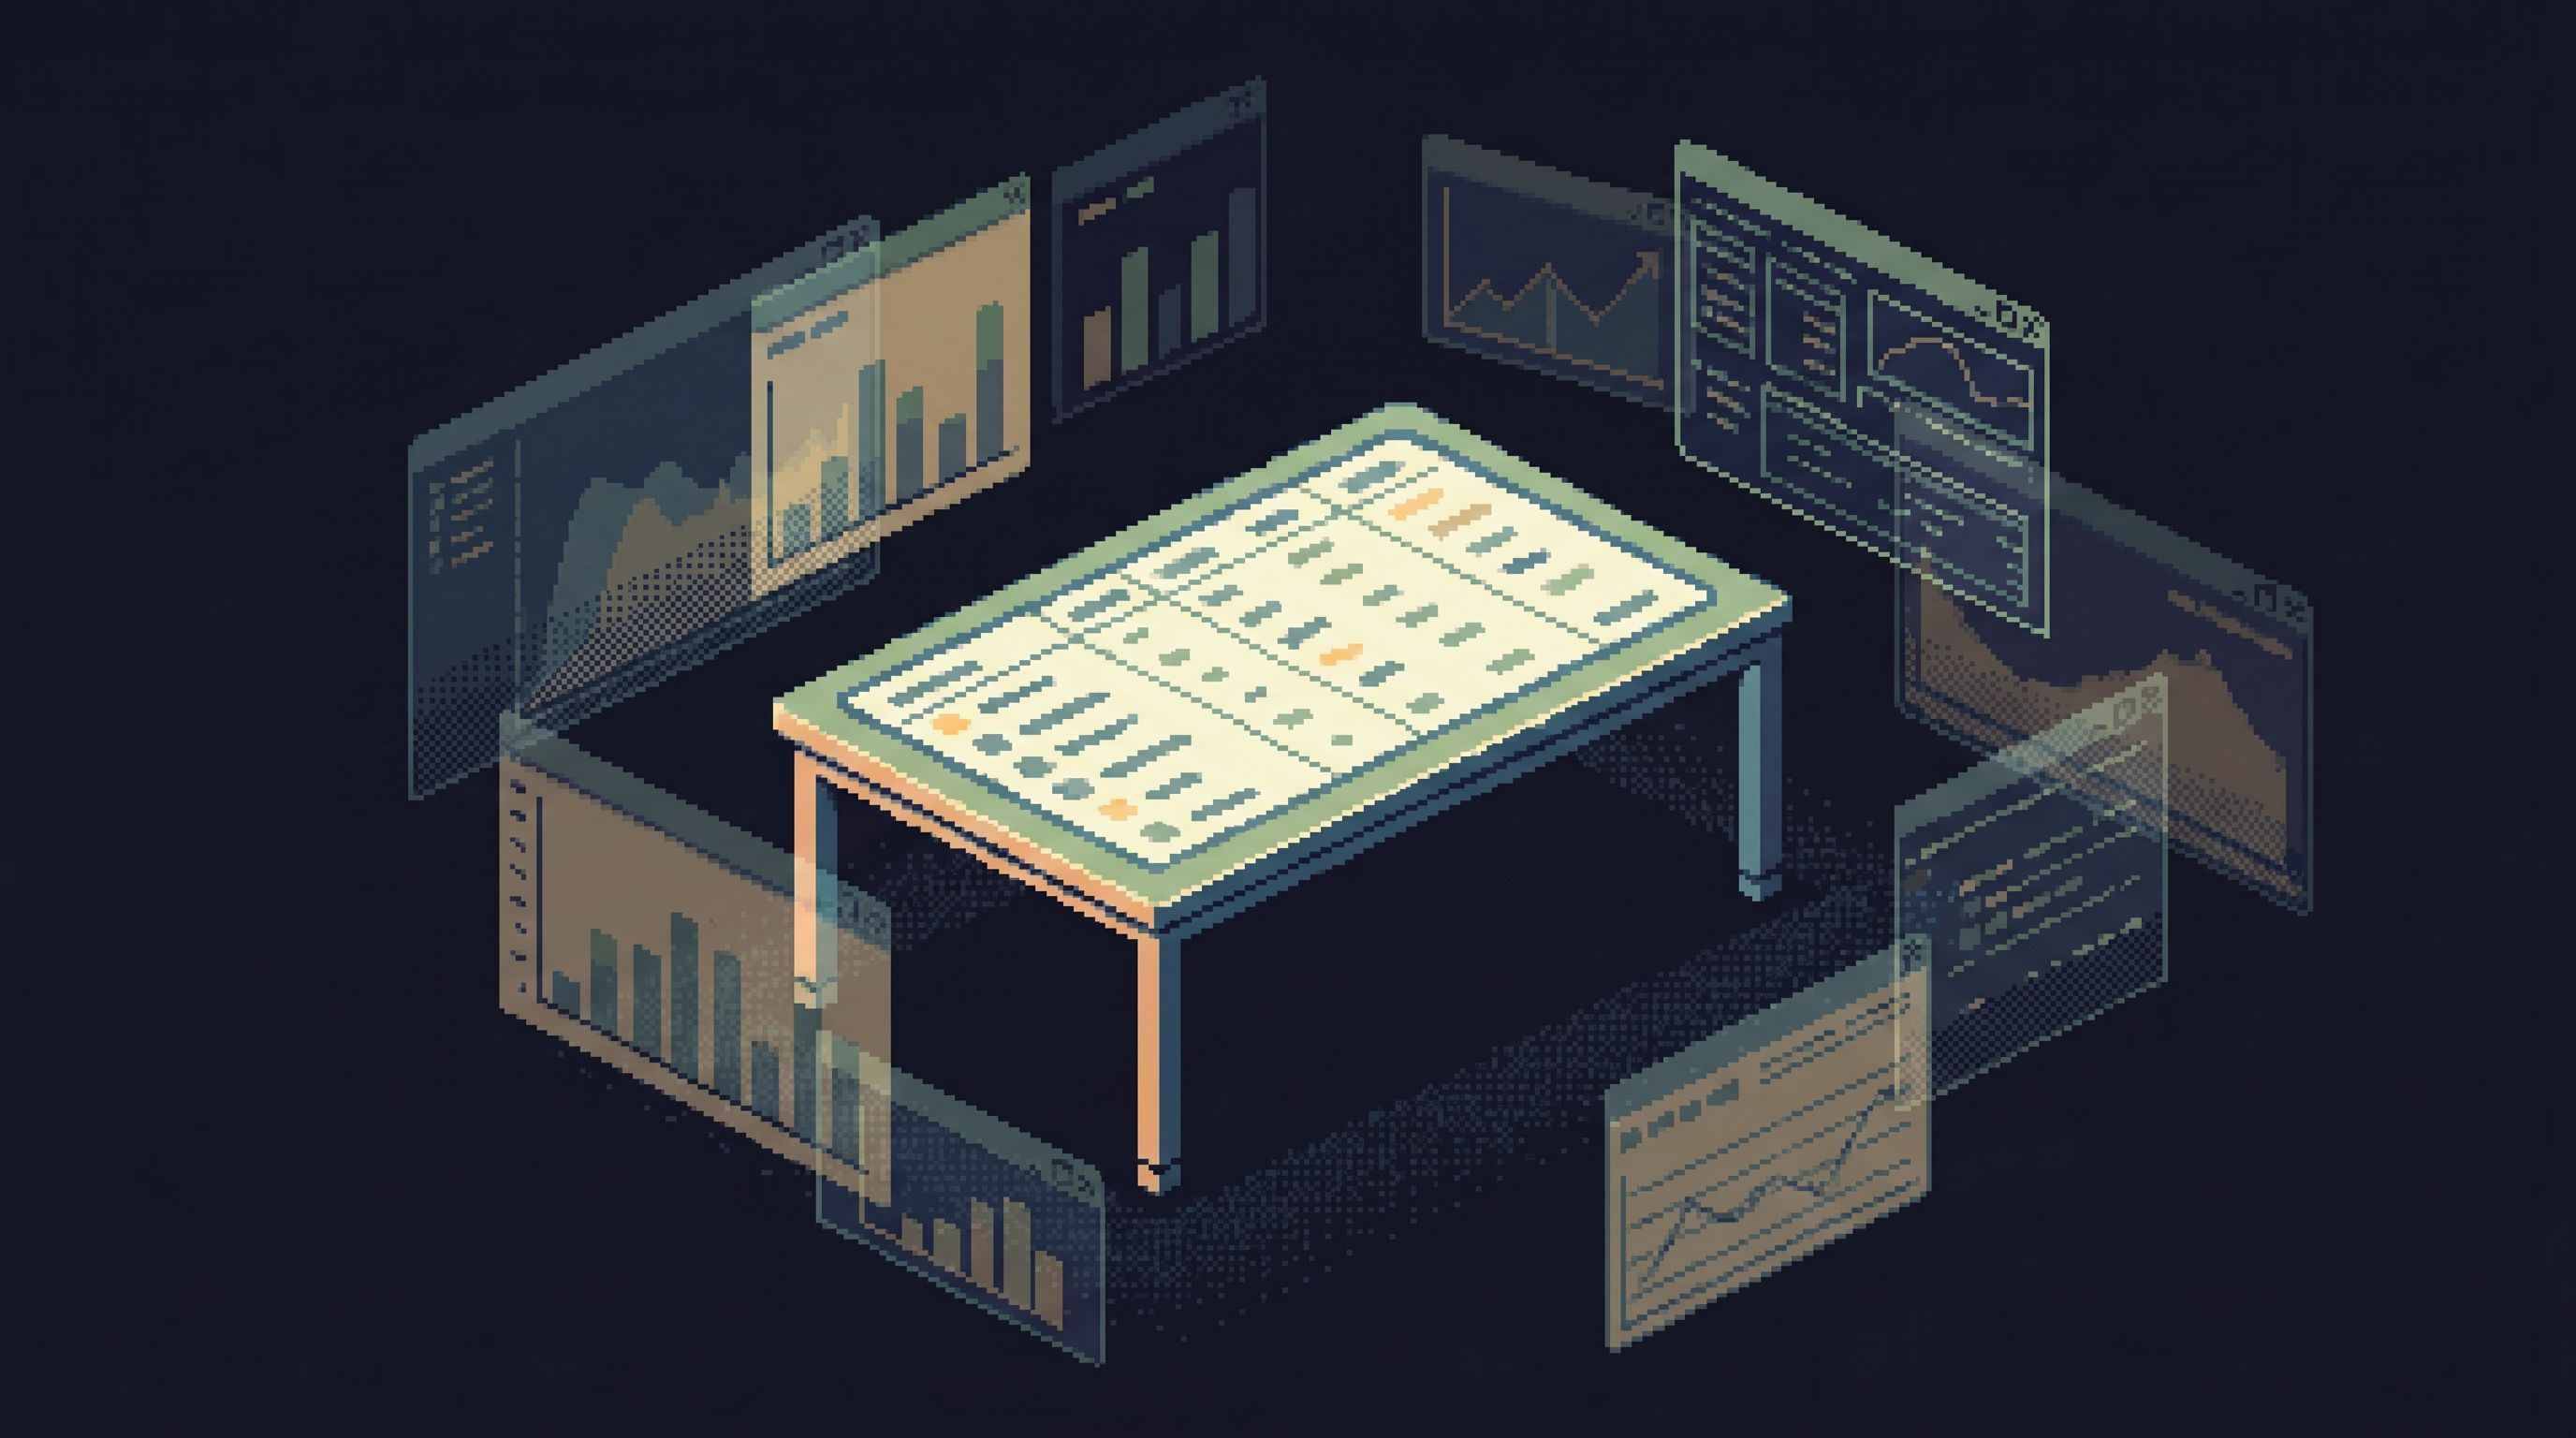
Tabs everywhere. Tiles of charts. Timelines of events, logs, and alerts. Each one is plausible. None of them are the place you actually work.
A post‑workspace browser is an argument for something quieter:
- One primary surface
- One clear question at a time
- One linear trail of what you looked at and why
No custom dashboard layouts. No tiled consoles. No timeline builders. Just a focused way to move from “something is wrong” to “I can explain what happened” by reading rows.
Tools like Simpl sit in this space: an opinionated database browser that gives you a calm, streamlined interface for exploring, querying, and understanding production data without the noise of full BI or admin tools.
Why the Classic Workspace Fights Production Debugging
The traditional “workspace” model assumes that more surface area equals more power:
- Multiple tabs for different queries
- Tiled charts and tables on one canvas
- Event timelines stitched from logs, traces, and metrics
It looks impressive. But when you’re debugging a concrete issue — a wrong invoice, a stuck job, a broken signup — that surface area turns into drag.
Here’s what typically happens:
-
The question is simple.
“Why did this user’s subscription cancel yesterday?” -
The workspace explodes.
You open a BI dashboard, a SQL IDE, an admin panel, logs, error tracker, maybe a notebook. -
Your attention fragments.
You’re managing:- Which tab has the “right” view
- Which chart is up to date
- Which query is safe to re‑run
- Which tool is on prod vs staging
-
The story gets lost.
You stop following the user. You start following the tools.
We’ve written before about this failure mode in Database Work Without Multitasking: Running a Whole Debug Session From One Intent. The issue isn’t SQL skill. It’s attention.
A workspace full of tabs, tiles, and timelines is optimized for showing many things at once. Production debugging is about understanding one thing clearly.
What “Post‑Workspace” Actually Means
Post‑workspace doesn’t mean “no UI.” It means dropping the idea that you need to design a workspace before you can do the work.
Instead of:
- Pinning panels
- Arranging tiles
- Saving layouts
- Curating timelines
…you rely on a browser that does three things well:
-
Centers one primary view
You’re always oriented around a single, legible surface: a table read, a narrow query, or a scoped record view. -
Keeps a linear trail
Every step you take — filters, queries, pivots — becomes part of a replayable path, not a pile of tabs. -
Makes context appear on demand
Related rows, historical states, and key metadata are one click away, not pre‑tiled into a noisy cockpit.
Instead of constructing a workspace, you walk a trail.
This is the same stance behind the “anti‑workspace” idea in The Anti‑Workspace: Why Fewer Panels Make Database Debugging Easier. Fewer panels, more story.
Why Tabs, Tiles, and Timelines Feel Productive (But Aren’t)
The classic workspace patterns are attractive for good reasons.
Tabs: the illusion of parallel progress
Tabs let you:
- Keep multiple hypotheses “open”
- Bounce between different tables and queries
- Avoid closing anything “just in case”
The cost:
- You lose the order of operations (which query led to which)
- You repeat work because you can’t remember where you saw something
- You never quite know which tab reflects the latest understanding
Tiles: the illusion of coverage
Tiled dashboards and multi‑panel views promise:
- “Everything important on one screen”
- Metrics, logs, and rows side by side
- A cockpit for incidents
The cost:
- Your eyes constantly scan for “the important thing”
- Panels silently drift out of sync with reality
- You spend time maintaining the layout instead of reading the data
Timelines: the illusion of narrative
Event timelines and stitched traces suggest:
- A clear story of what happened when
- Automatic correlation across systems
The cost:
- You trust the projection more than the underlying rows
- You struggle to answer simple “before/after” questions on real data
- You still end up hopping to a database tool to confirm details
We explored this “rows vs narrative” tension in From Tables to Stories: Turning Production Reads into Sharable Debug Narratives. The key insight: the story lives in the sequence of reads you perform, not in the layout of panels you arrange.
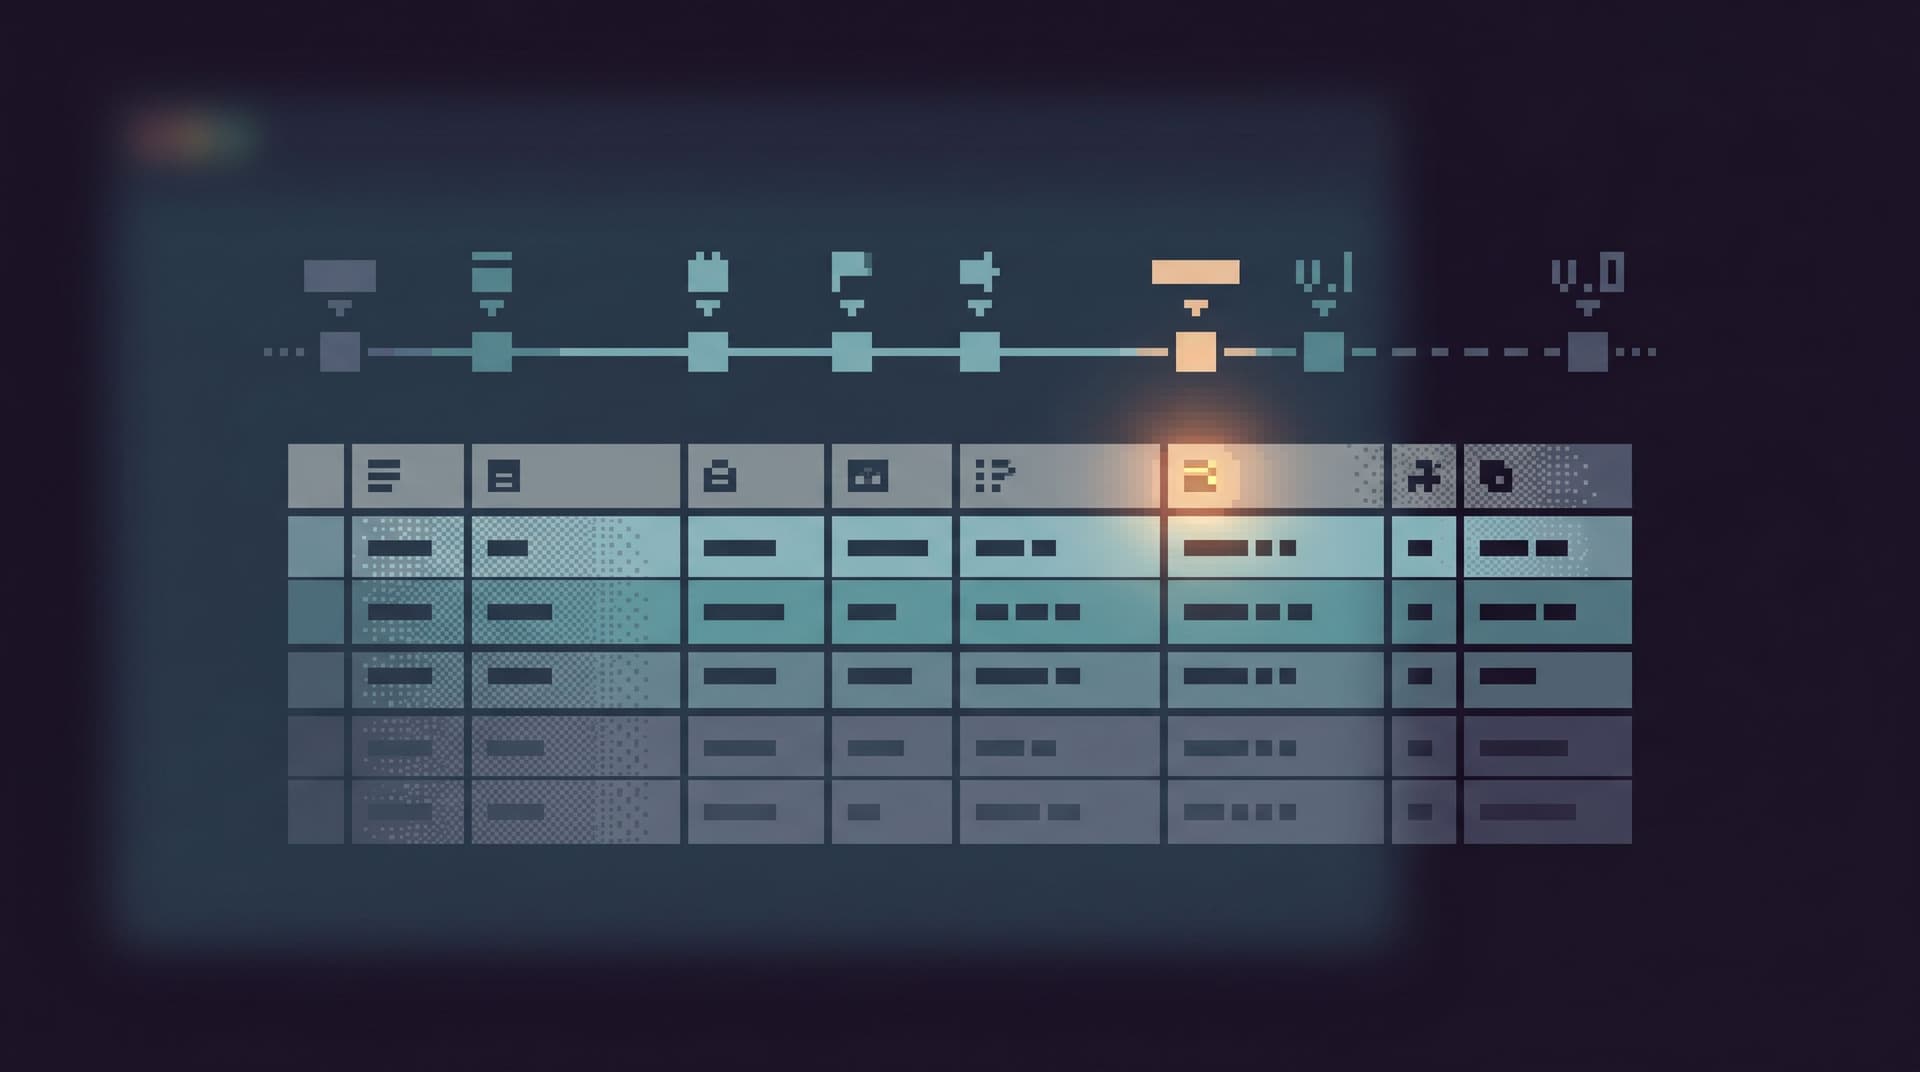
The Core Principles of a Post‑Workspace Browser
A post‑workspace browser — something like Simpl — is built on a different set of assumptions.
1. One intent at a time
You start from a single, explicit question:
- “Why did this invoice total change between charge attempts?”
- “Which jobs for this tenant started failing after the last deploy?”
- “What did this user’s subscription look like before the downgrade?”
Everything in the browser is shaped around that intent:
- The primary view is anchored on the subject (user, job, invoice)
- Related tables are reachable, but not pre‑exploded
- Queries are narrow and scoped to the question
This is the same posture as a “single‑intent session” from our earlier piece on Database Work Without Multitasking: you don’t multitask incidents.
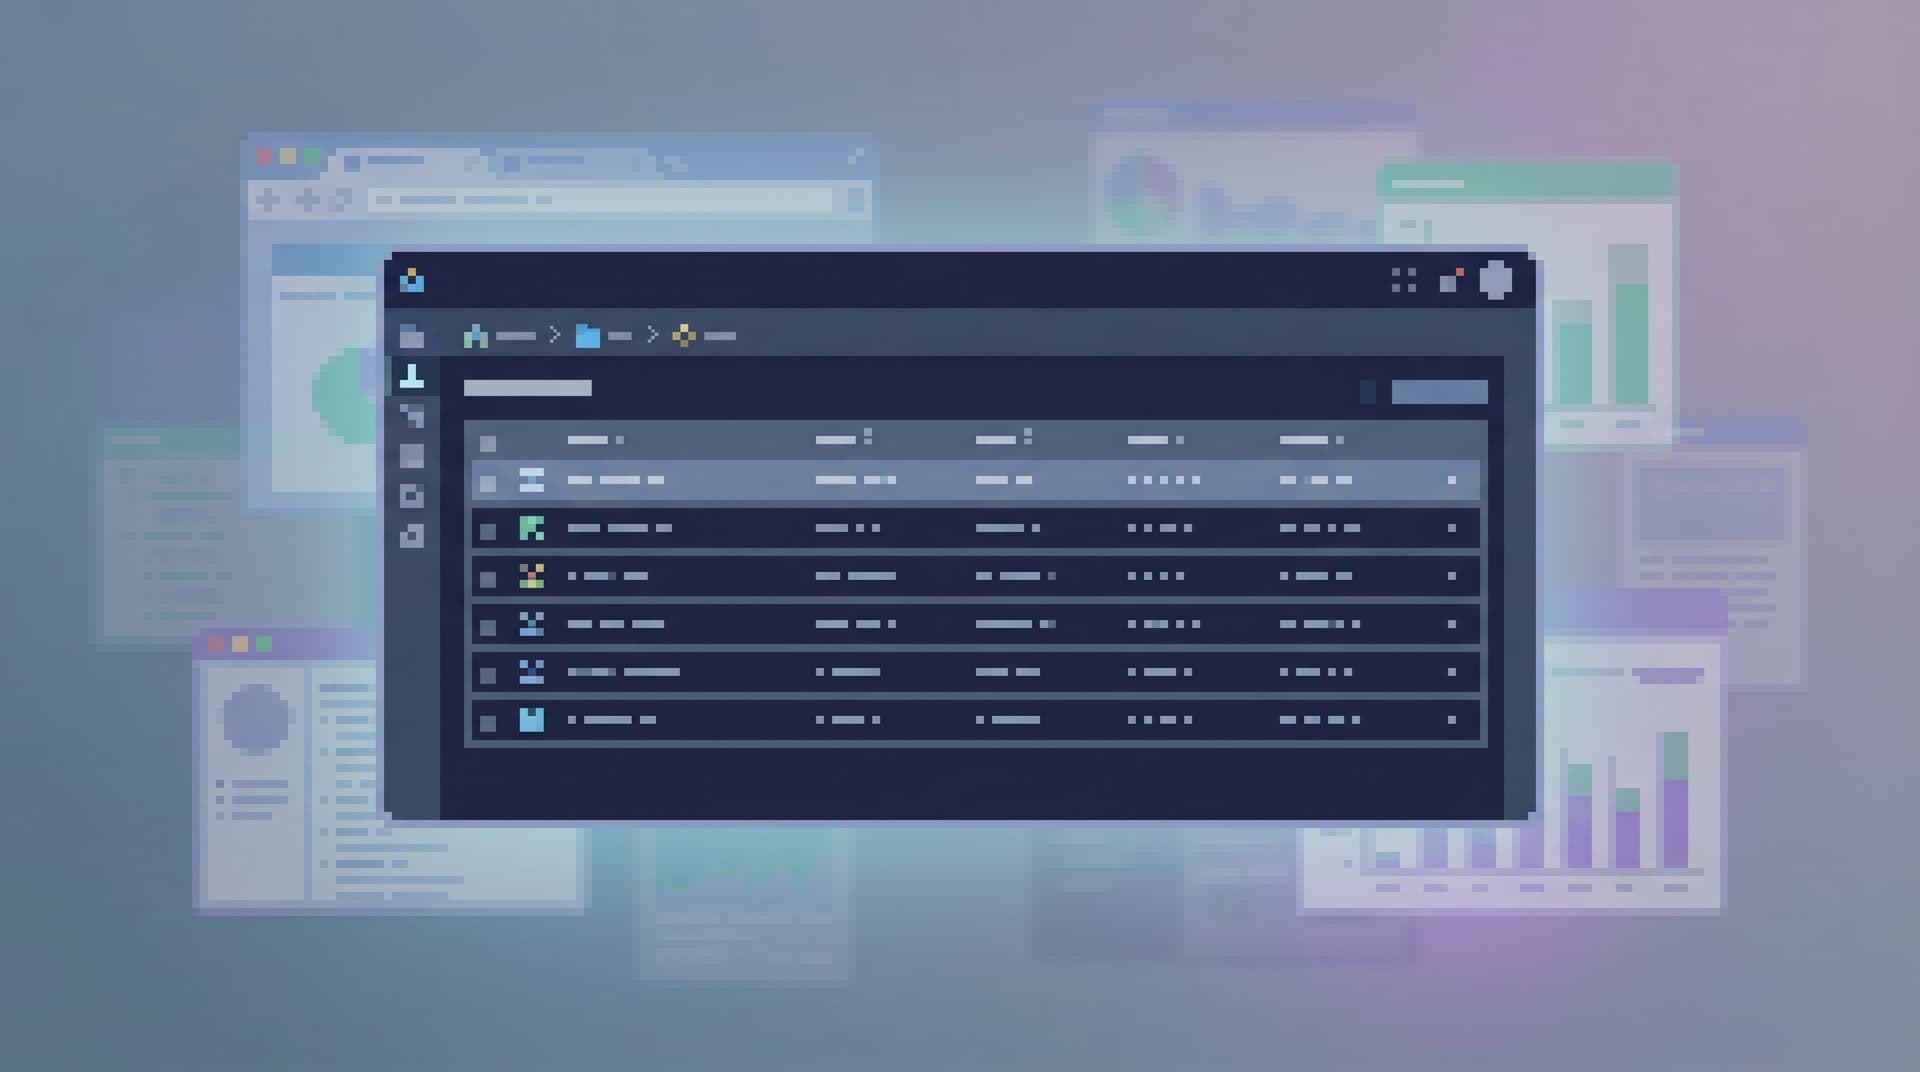
2. Linear, replayable trails instead of tab piles
Rather than opening a new tab for every idea, you build a trail:
- Step 1: Filter
subscriptionsby user and time - Step 2: Jump to related
invoices - Step 3: Pivot to
paymentsfor a specific invoice - Step 4: Compare states before and after a deploy
The browser records this as a sequence you can:
- Scroll back through
- Annotate with notes
- Share with another engineer
- Replay later during a post‑mortem
This “trail over stash” mindset is explored more deeply in Post‑Saved‑Query Workflows: How Opinionated Trails Replace Personal SQL Stashes.
3. Just‑enough structure, not a full schema map
You don’t need an ERD wall or a full catalog view to debug a subscription bug.
You need:
- The few tables that matter
- The key relationships between them
- Enough metadata to feel safe and oriented
A post‑workspace browser surfaces structure the way a good city map does:
- Major roads (core tables) are clear
- Local streets (supporting tables) appear when relevant
- You never drown in every possible detail at once
This is the “calm schema surface” idea from The Calm Schema Surface: Showing Just Enough Structure for Everyday Production Reads.
4. Read‑only by default, by design
If the browser is going to be the primary surface during incidents, it must feel safe.
That means:
- No inline edits
- No surprise write buttons
- No bulk actions next to production reads
Opinionated read‑only access is not a limitation; it’s what lets you invite more people into the tool without raising the stakes of every click.
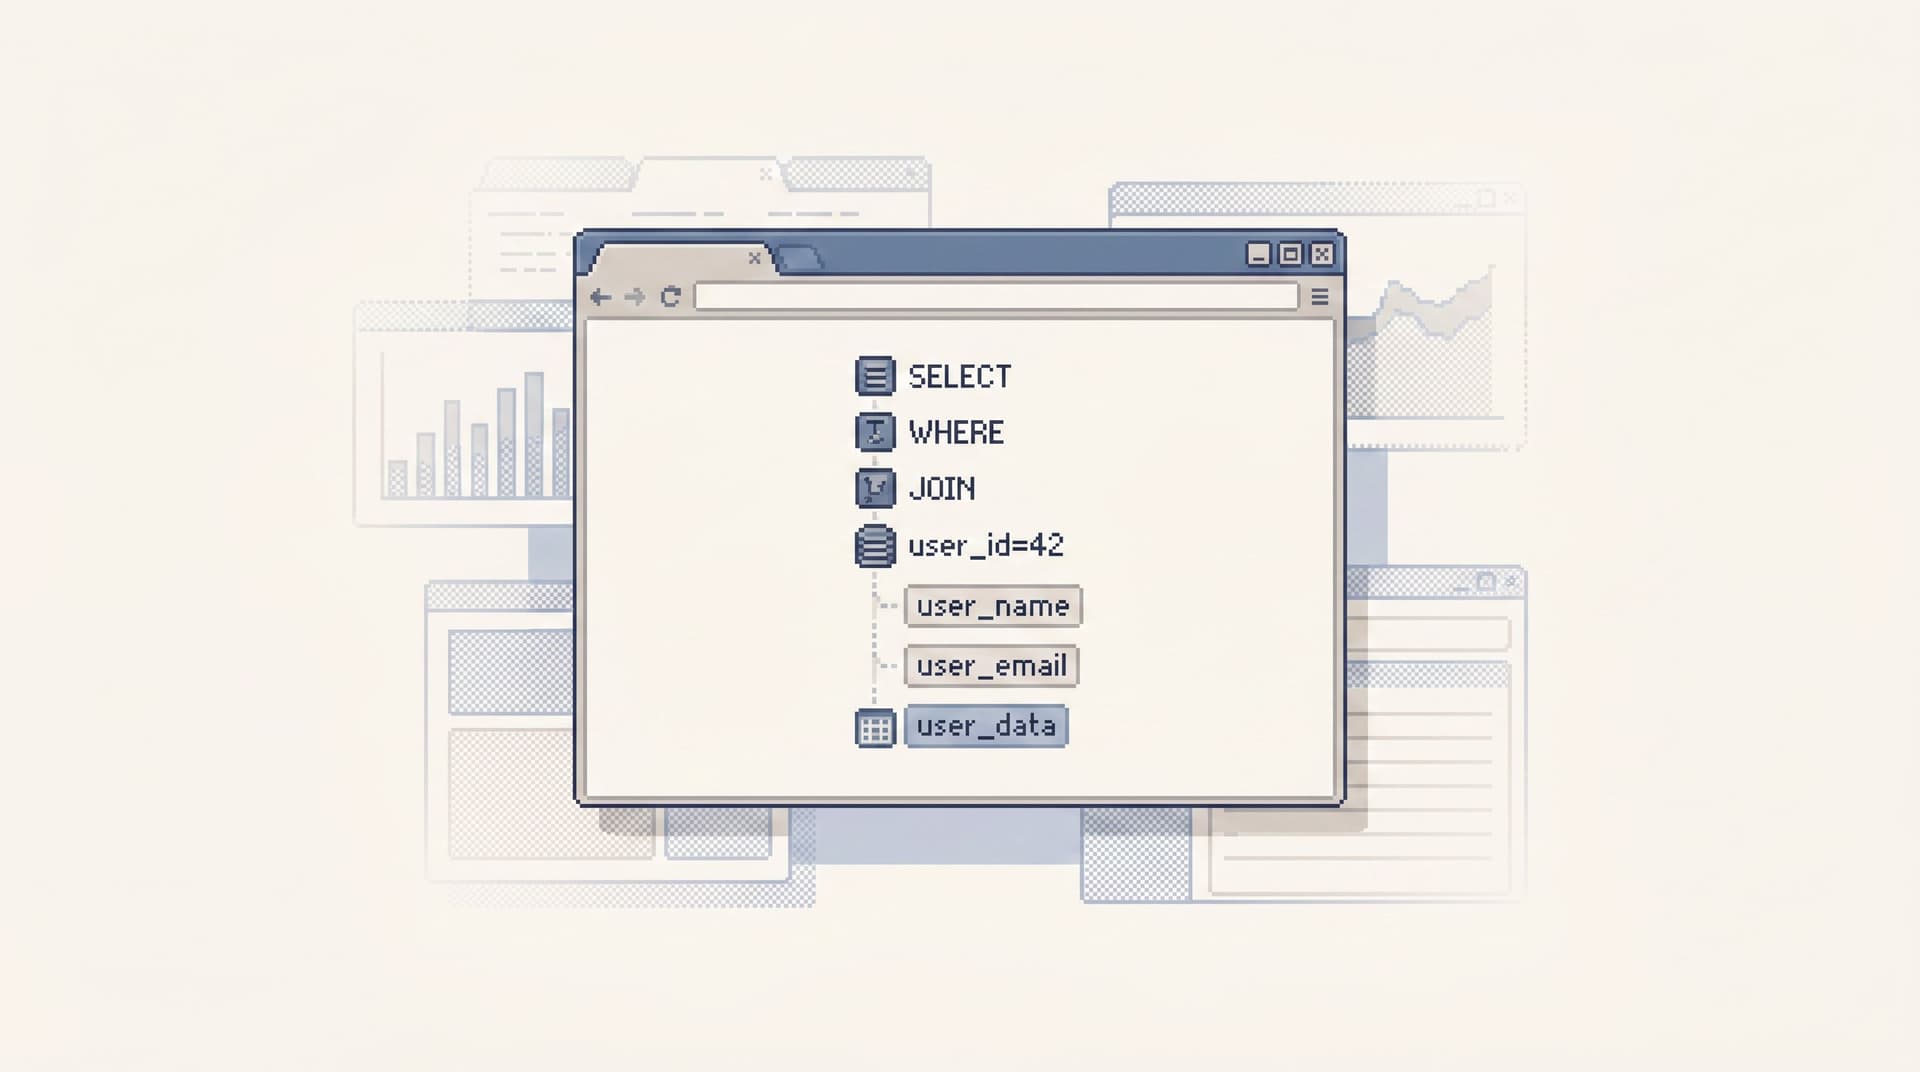
How to Debug Without a Workspace: A Concrete Flow
Let’s walk through a realistic scenario in a post‑workspace browser like Simpl.
Incident: Support reports that a customer was charged twice for the same invoice.
Step 1: Anchor on the subject, not the metric
Instead of starting with a revenue dashboard, start with the customer:
- Search by customer ID or email.
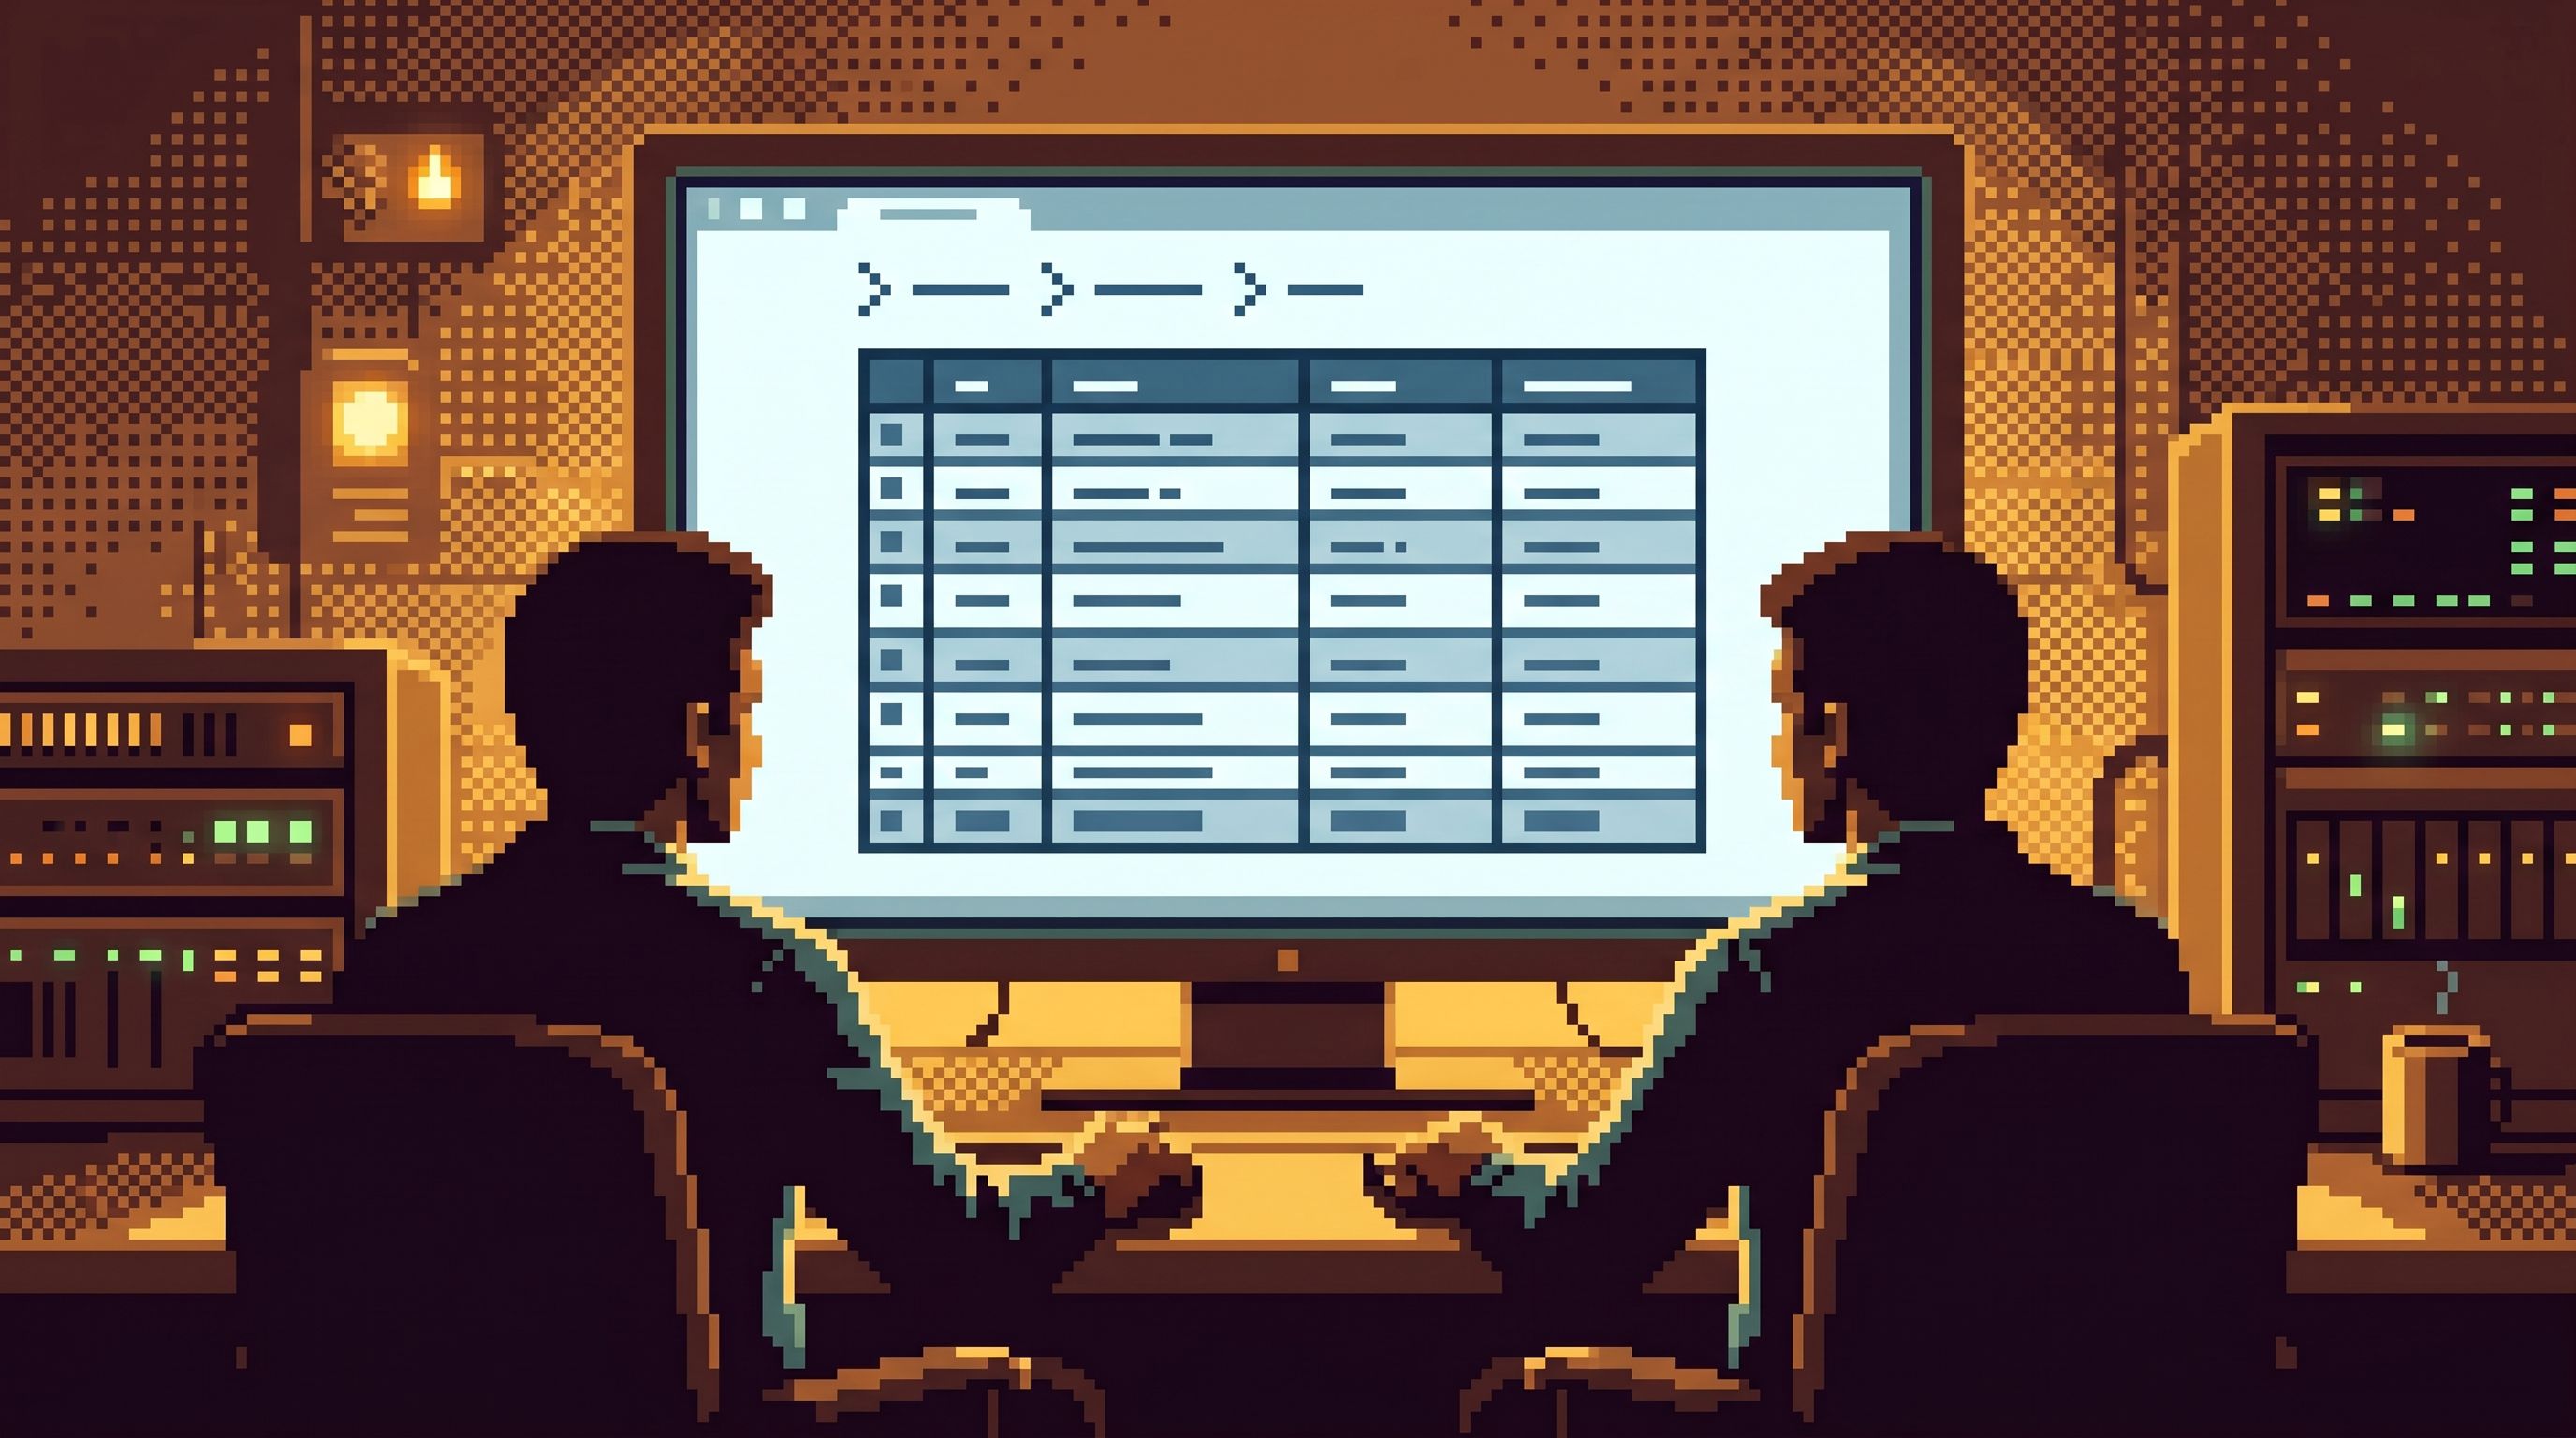
- Land on a focused view of that customer’s core tables:
customerssubscriptionsinvoicespayments
No tiles. No metrics. Just the rows that define this customer’s relationship with your system.
Step 2: Walk the natural joins, not the workspace
From the customer view:
- Filter
invoicesto the relevant date range. - Open the suspicious invoice in the primary view.
- Jump to related
paymentsvia a simple relation link.
Your trail now looks like:
- Customer → Invoices (filtered) → Invoice #123 → Payments for Invoice #123
You haven’t opened a second tool. You haven’t rearranged panels. You’ve just followed the story.
Step 3: Read before/after states directly from rows
Double‑charge bugs are often about timing:
- Retries
- Idempotency keys
- Race conditions
A post‑workspace browser makes it easy to:
- See payment attempts ordered by time
- Compare fields that changed between attempts
- Jump to related jobs or events if those are modeled as tables
If you’ve invested in historical reads (soft deletes, audit tables, versioned rows), this is where a tool like Simpl can surface time‑travel views inline. For a deeper dive into that pattern, see Opinionated Time Travel: Calm Patterns for Reading Historical States in Production Data.
Step 4: Mark the turning points in the trail
As you notice key facts, you annotate the trail instead of creating new tabs:
- “First payment attempt failed with
network_error.” - “Second attempt succeeded but invoice status already
paid.” - “Job
retry_paymenttriggered twice within 5 seconds.”
These notes live where the reads happened. When you share the trail, another engineer can:
- Replay the same queries
- See the same rows
- Follow the same reasoning
No Slack archaeology. No screenshots of dashboards.
Step 5: Capture the story once, not the workspace forever
When the incident is resolved, you don’t “save a workspace.” You keep:
- The trail as a reusable investigation path
- The key queries as part of that trail
- The notes as a narrative overlay
Later, when someone asks “Have we seen this double‑charge pattern before?”, you:
- Open the trail
- Parameterize the customer ID
- Re‑run the same path for a new subject
You’ve turned a one‑off debug session into a small, calm playbook — without introducing a new tool or a new concept.
Designing Your Own Post‑Workspace Practice
You don’t need to rip out every dashboard to move in this direction. You can start with a few deliberate constraints.
1. Declare “single‑surface incidents”
For a certain class of incidents — user‑level, row‑level, subscription‑level — decide that:
- All primary investigation happens in one database browser
- Dashboards are reference, not the main surface
- Logs and error trackers are entry points, not places you stay
If you’re using Simpl, this means:
- From an alert or stack trace, you jump into Simpl with the relevant IDs
- You stay there for the bulk of the investigation
This is a natural extension of the “single‑database day” idea from The Single‑Database Day: What Happens When Engineers Only Read From One Calm Surface.
2. Replace tab habits with trail habits
Next time you feel the urge to open a new tab:
- Ask whether this is a new intent or the same one
- If it’s the same, stay in the same primary view and extend the trail
- Use annotations instead of new windows to mark branches
Over time, your team will:
- Stop bookmarking random query URLs
- Stop screenshotting tables into Slack
- Start sharing actual investigation trails
3. Shrink your data tool stack around the browser
Look at every tool you currently open during a typical debug session:
- SQL IDE
- BI dashboards
- Admin panels
- Notebooks
- Log viewers
Ask, for each one:
Is this where we read the truth, or where we route to the truth?
Where possible:
- Keep the router (alerting, error tracking), but end the path in a calm browser
- Remove redundant read surfaces that show the same rows in louder ways
We wrote about this “quiet consolidation” in The Quiet DX Upgrade: Shrinking Your Data Tool Stack Without Losing Observability.
4. Make read‑only the default, not the exception
Finally, codify a simple rule:
- The primary surface for reading production data is read‑only
- Any write‑adjacent actions happen elsewhere, on purpose
This reduces:
- Fear when sharing the tool with non‑experts
- Risk during high‑stress incidents
- The temptation to bolt admin features onto your browser
A tool like Simpl leans hard into this: it refuses to become your admin panel, so your read surface stays calm.
Summary
A post‑workspace browser is less about a specific feature set and more about a posture:
- From layouts to trails. You stop designing dashboards and start walking linear, replayable paths through real rows.
- From multitasking to single intent. You trade a pile of tabs and tiles for one primary view anchored on a concrete question.
- From cockpit thinking to narrative thinking. You care less about seeing everything at once, and more about being able to explain what happened to one user, invoice, or job.
- From flexible power to calm safety. You choose read‑only, narrow, opinionated tools like Simpl over general‑purpose SQL IDEs pointed at production.
The result isn’t just fewer windows. It’s a different feel to database work: quieter, more legible, and easier to share.
Take the First Step
You don’t need a full migration to feel the benefits of post‑workspace debugging.
Pick one upcoming incident or tricky support case and try this:
- Choose a single, calm database browser — ideally Simpl or something with similar constraints.
- Commit to running the whole investigation from that one surface.
- Capture your path as a trail instead of a workspace: the sequence of reads, not the arrangement of panels.
- Share that trail with one other engineer and ask a simple question: Was this easier to follow than our usual pile of tabs?
If the answer is yes, you’ve already started.
From there, you can grow the practice: single‑surface incidents, shared trails, fewer tools, calmer debugging.
The workspace can shrink. Your understanding doesn’t have to.