Database Work Without Multitasking: Running a Whole Debug Session From One Intent

Most database debugging sessions don’t fail on SQL. They fail on attention.
You start with a clear question:
“Why did this customer’s invoice come out wrong?”
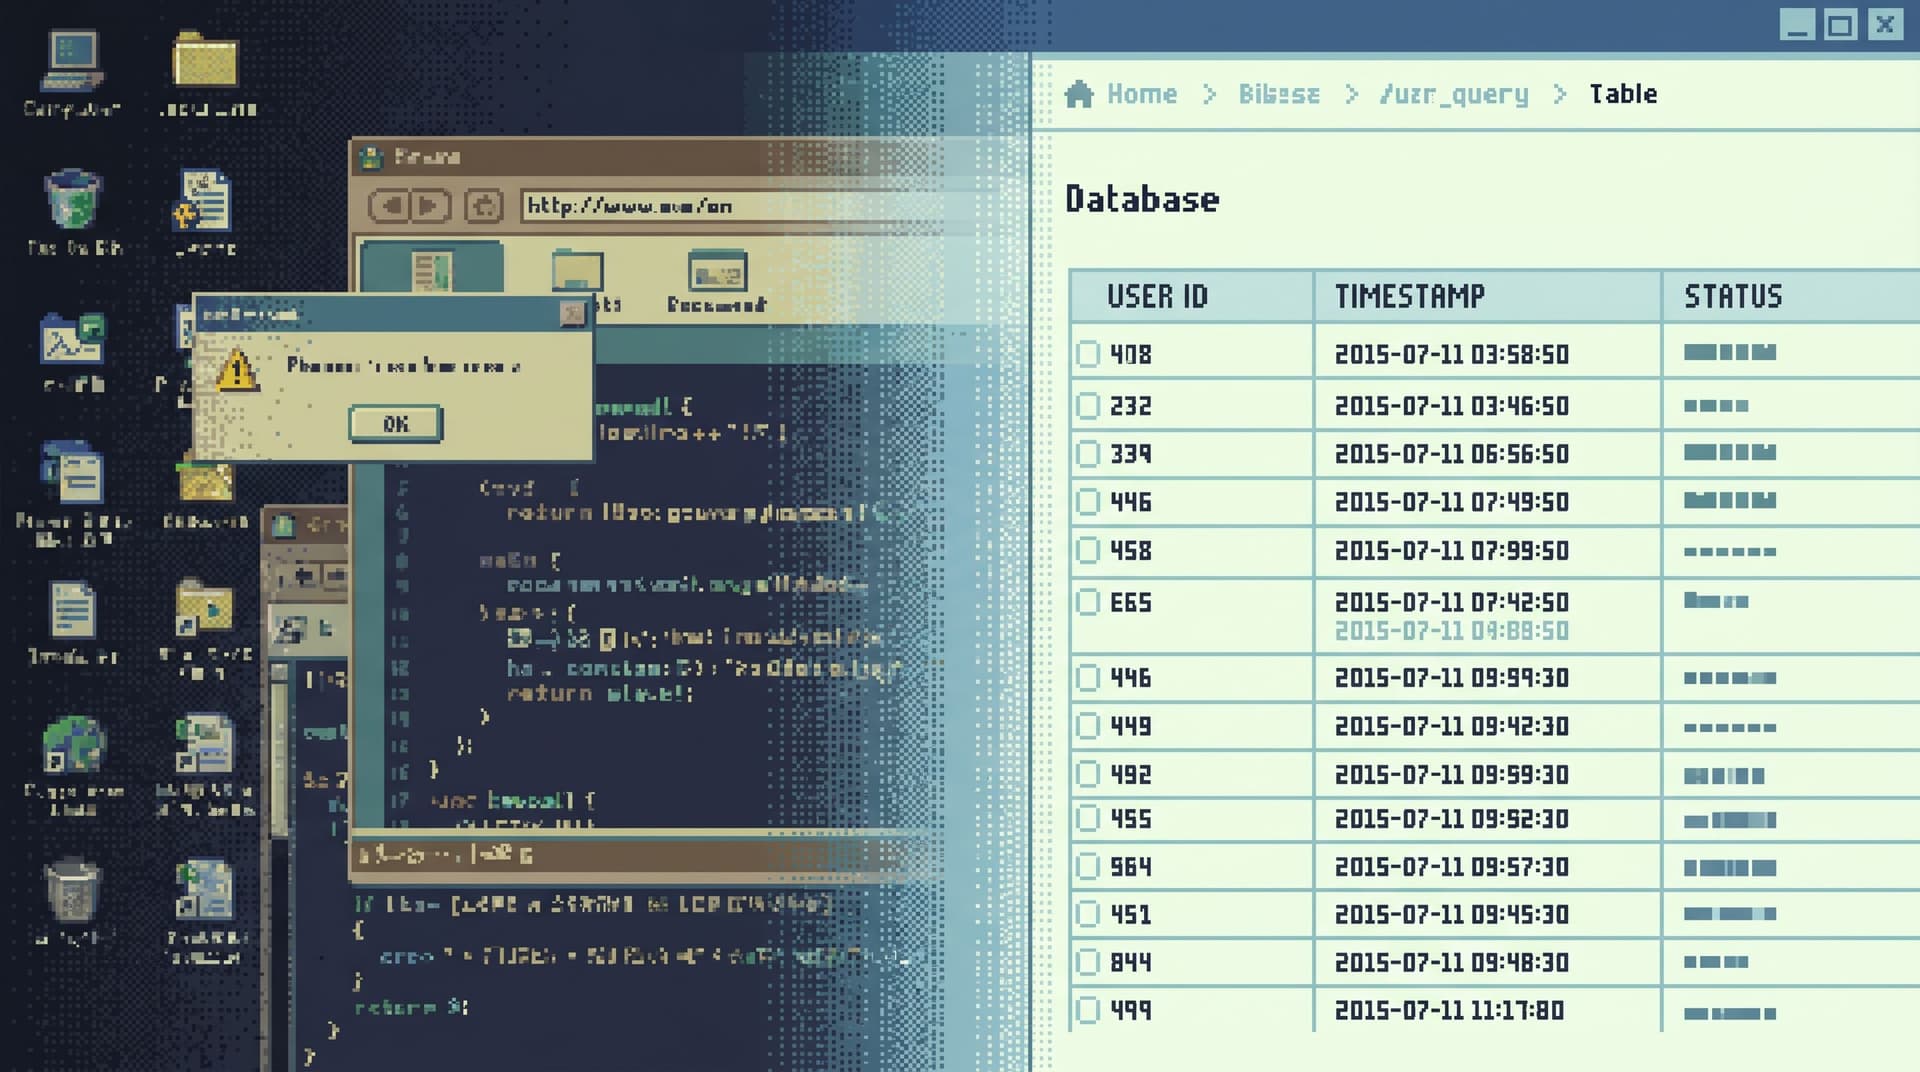
Ten minutes later, you’re juggling:
- A SQL IDE
- A BI dashboard
- An admin panel
- Log search
- Error tracker
- Three Slack threads
The original intent has dissolved into tab management. You’re not following the bug anymore; you’re following the tool you happen to have in front of you.
This post is an argument for a different posture: database work without multitasking. A whole debug session run from one clear intent, inside one primary surface, with as few context switches as possible.
Tools like Simpl are built around this stance: an opinionated database browser that lets you explore, query, and understand production calmly, without dragging you into full BI or admin complexity.
Why one intent matters more than one more tool
When you debug from production data, you’re doing narrative work:
- Something happened.
- You gather evidence across tables.
- You form and test hypotheses.
- You arrive at a coherent explanation.
Every extra tool, tab, or mode is a potential narrative break. Even small context switches add measurable cognitive cost; research on task switching consistently shows performance drops and error rates rising when people bounce between tools, even when the tasks feel related.
In database work, that cost shows up as:
- Lost threads – you forget why you opened a query, or which user ID you were following.
- Duplicate effort – you re-run the same investigation in three places because none of them holds the whole story.
- Silent risk – you copy-paste IDs and SQL between tools, hoping you didn’t drop a filter.
- Opaque outcomes – nobody can replay how you got from alert to explanation.
A single-intent, single-surface debug session fights all of that:
- Less decision overhead – you’re not constantly choosing where to look next.
- Cleaner mental model – one trail, one story, one place to re-read it.
- Lower risk – fewer places to accidentally run the wrong query or hit the wrong button.
- Better sharing – the path you took is easier to show, review, and reuse.
If you’ve read about the anti-workspace stance, this is the same idea, applied specifically to debugging: fewer panels, fewer modes, more attention on the rows.
What “one intent” actually looks like
“Run a whole debug session from one intent” sounds abstract. Let’s make it concrete.
A good single intent looks like this:
“Trace everything that happened to subscription
sub_123between June 1 and June 7, and explain why the June 3 invoice is wrong.”
It is:
- Specific – a narrow object (one subscription), a clear time window.
- Outcome-oriented – you’re aiming for an explanation, not just “look around.”
- Bounded – you know when you’re done: when you can tell the story end to end.
A bad intent looks like:
“See what’s going on with billing.”
Too broad. No clear stopping point. Guaranteed to spawn more tabs than answers.
When you start a debug session, write the intent down somewhere visible:
- At the top of your incident doc
- In the title of your Simpl trail or session
- In the subject line of the Slack thread you’re coordinating in
Then treat everything you do as either:
- Directly serving that intent, or
- A distraction to capture and defer.
Designing a single-surface debug session
Running a whole session from one intent requires a matching environment: one primary surface where 90%+ of the work happens.
You can approximate this posture with existing tools, but it’s much easier if you start from an opinionated browser like Simpl: read-only, narrow query surface, calm schema, and a linear trail of steps.
Here’s a practical pattern you can adopt.
1. Start from the object, not the schema
Most sessions start in the wrong place: a blank SQL editor or a full schema tree.
Instead, start from the object at the heart of the incident:
- The user ID from a support ticket
- The order ID from a log line
- The job ID from a failed worker
- The subscription ID from a billing alert
Then:
- Land on the primary table for that object (e.g.,
subscriptions). - Filter by the ID and time range in your intent.
- Read a handful of rows slowly.
This is the same posture as the anti-metric debug session: metrics and dashboards can tell you that something is wrong, but the story lives in the rows.
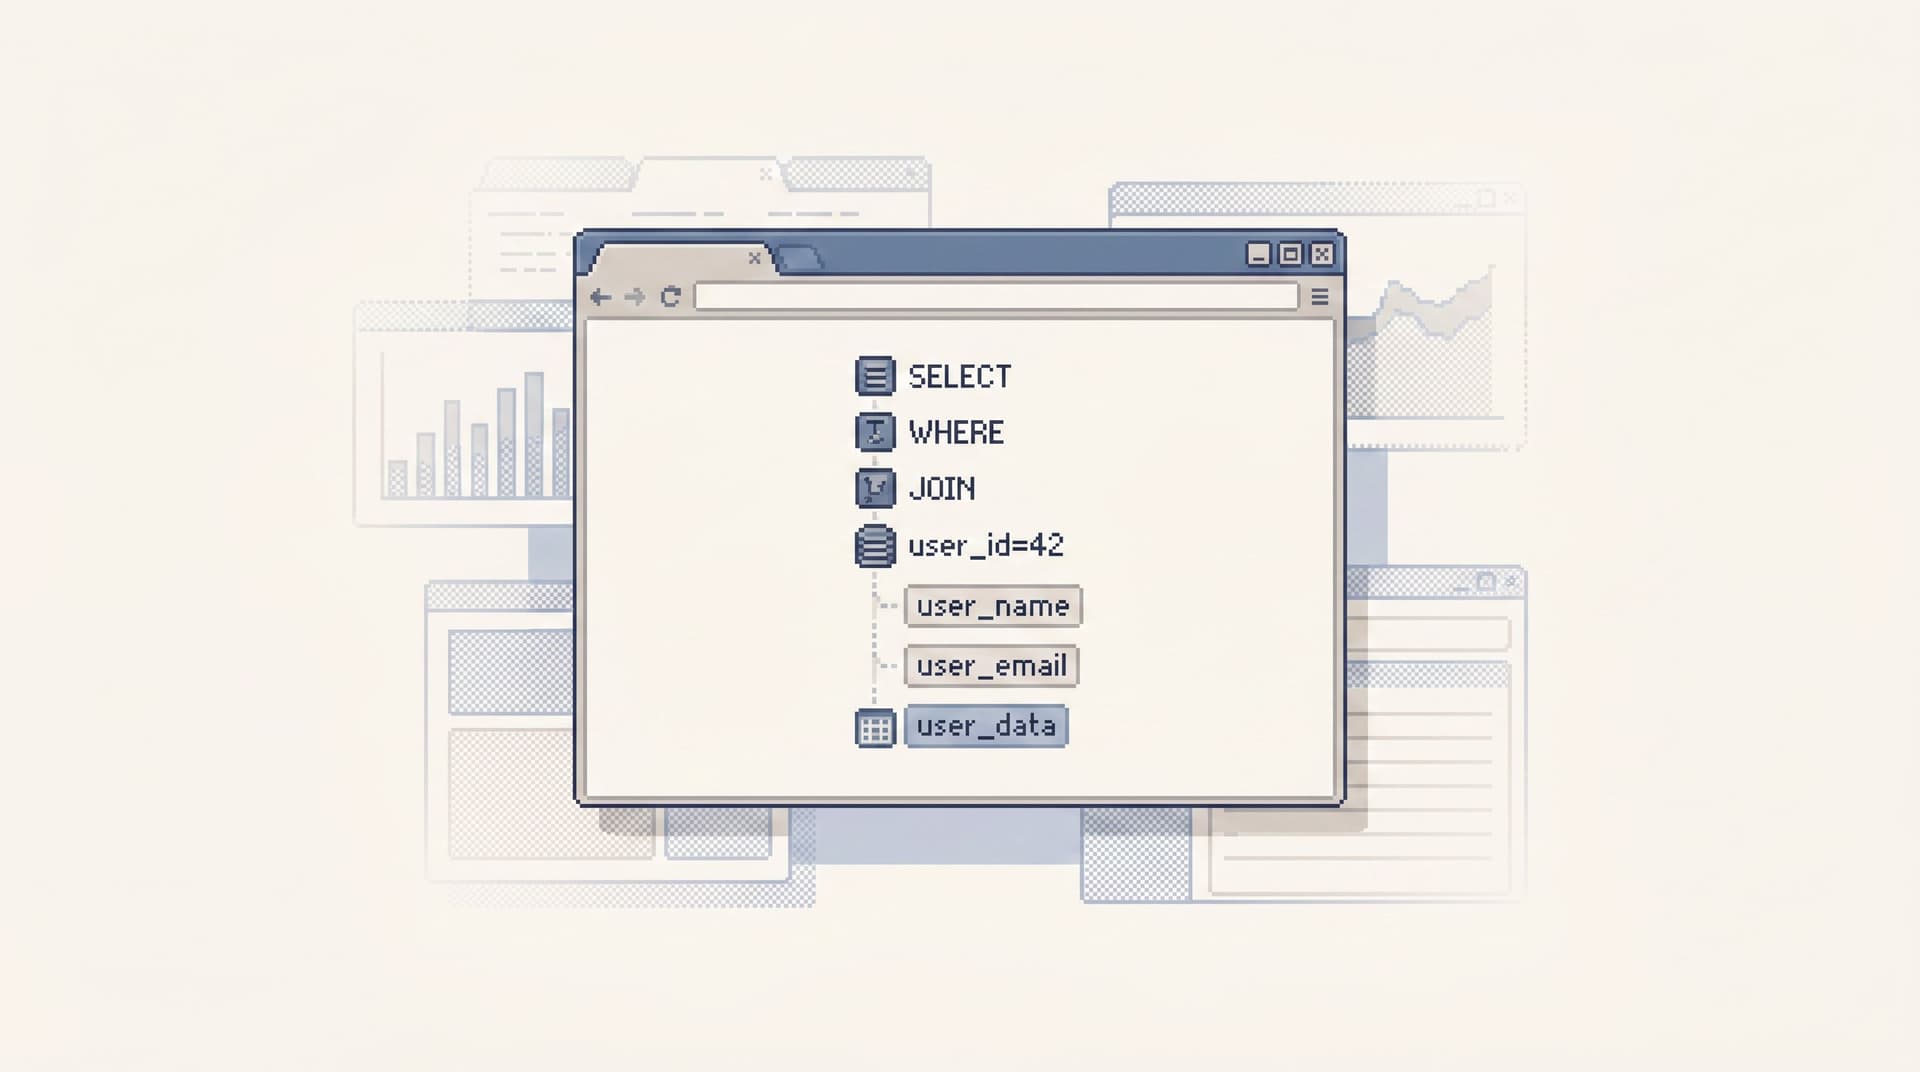
2. Follow the natural joins, but keep them linear
Once you’re anchored on the primary object, you’ll need to branch out:
- Invoices linked to the subscription
- Payments linked to invoices
- Events linked to payments
The temptation is to open each of these in a new tab, a new tool, or a new mode. That’s how multitasking creeps in.
Instead, keep the path linear:
- Use one browser tab or window as the “trail.”
- Move step by step: subscription → invoices → payments → events.
- Let each step capture both the query and the result.
In a tool like Simpl, this becomes a literal trail: each filter, each query, each table hop is a step you can scroll back through. No need for extra screenshots, saved queries, or side notes.
If you’re stuck with a more traditional SQL IDE, you can still fake this:
- One editor tab per incident.
- One query block per step, with a short comment above it explaining why you ran it.
- No cross-pollination between incidents.
It’s clunkier, but the principle is the same: one visible trail, not a scattered pile of queries.
3. Keep your query surface deliberately narrow
Multitasking isn’t just about tools; it’s also about degrees of freedom.
A full SQL IDE pointed at production invites you to:
- Try three hypotheses at once
- Join half the schema “just in case”
- Rewrite queries mid-stream without leaving a trace
That feels powerful. It also makes it easy to drift away from your original intent.
A calmer option is a narrow query surface:
- Read-only by default
- Limited verbs (e.g.,
SELECTonly) - Guardrails around dangerous patterns (
SELECT *on hot tables, missingWHERE, etc.) - Just enough SQL to express your investigation, not to redesign your warehouse
If you want to go deeper on this idea, the post on the narrow query editor is a good companion.
The key here: every extra capability is a potential branch in your mental tree. For a single-intent session, you want fewer branches, not more.
4. Capture questions, don’t chase them
During a real incident, you’ll constantly notice side questions:
- “Are other customers affected?”
- “Did this start after the last deploy?”
- “Is this limited to one region?”
These are good questions. They’re also how a single-intent session quietly explodes into a multi-incident investigation.
Instead of chasing each question immediately, capture and defer:
- Keep a small “later” list in your incident doc or inside your browser’s notes.
- Only promote a side question into a new intent when you’ve closed the current one.
- If a side question is urgent enough to interrupt, treat it as a new session with its own explicit intent.
This is the same discipline you’d use in focused programming sessions. Database work deserves the same respect.
5. Make the trail sharable by default
A single-intent session is only as good as its ability to be replayed.
At the end of the investigation, you should be able to hand someone a single artifact and say:
“Scroll from top to bottom. You’ll see exactly how we got from the alert to the explanation.”
That artifact might be:
- A Simpl trail link
- A short incident doc with embedded screenshots and queries
- A notebook with one cell per step (if you keep the linear structure)
The important part is linearity and legibility, not the specific tool.
This is where the ideas from From Tables to Stories become powerful: you’re not just leaving behind queries, you’re leaving behind a story.
A good trail has:
- The original intent at the top
- A sequence of clearly labeled steps
- Enough context (IDs, timestamps, key fields) to rerun each step
- A short summary at the end: what you concluded, what changed, and what remains unknown
6. Close the loop before you open a new one
The end of a debug session is where multitasking often sneaks back in.
You’ve found the cause. Someone is shipping a fix. Slack is quieter. This is the easy moment to drift into a new question, a new tab, a new incident—without fully closing the previous loop.
Resist that.
Before you move on:
- Write the story in one paragraph.
- What happened.
- Why it happened.
- How you know.
- Tag the trail.
- Add labels for table names, feature area, and severity.
- Extract any reusable patterns.
- Queries that should become part of a query library.
- Steps that should be added to runbooks.
This is how you gradually move from a “query zoo” to a calmer query library: each single-intent session leaves behind something the next person can reuse.
Real-world patterns you can adopt this week
You don’t need to redesign your whole stack to benefit from single-intent sessions. You can start small.
Pattern 1: The one-tab incident
For your next incident involving production data, try this rule:
“All primary investigation happens in one browser tab.”
Practically:
- Use a single Simpl session or a single SQL editor tab.
- Use comments or built-in notes to label each step.
- Keep supporting tools (logs, error tracker) in the background, only bringing them forward when strictly necessary.
You’ll notice quickly where your current tool fights you—those are good signals for where a calmer browser would help.
Pattern 2: Intent-first handoffs
When you hand off an incident to another engineer, don’t just send links and screenshots. Send:
- The written intent
- The single trail or artifact
- The one-paragraph story so far
This keeps the next person anchored in the same narrative, instead of reconstructing your mental state from scattered evidence.
Pattern 3: Weekly trail review
Once a week, review a few recent debug trails as a team:
- Did the session stay aligned with its original intent?
- Where did multitasking creep in?
- Which steps could be turned into reusable paths or templates?
Over time, this turns “how we debug from production” into a shared craft, not a private habit.
How tools like Simpl help
You can practice single-intent debugging with almost any stack, but some tools make it much easier.
An opinionated browser like Simpl is designed around this style of work:
- Read-only by design – removes the fear of accidental writes, so you can invite more people into production debugging without a permissions maze.
- Calm schema surface – just enough structure to stay oriented, without drowning you in catalog details.
- Narrow query editor – focused on everyday production reads, not warehouse-scale data modeling.
- Linear trails – every step of your investigation is captured in order, ready to replay and share.
If you’re trying to move away from a sprawl of notebooks, IDEs, and admin panels, this is the kind of surface that lets you actually live the “single intent, single session” posture—not just talk about it.
Summary
Database debugging doesn’t have to feel like air-traffic control.
A calmer option is available:
- One clear intent per session – written down and visible.
- One primary surface – a browser or editor that holds the whole trail.
- Linear steps – from object to joins to explanation, without branching into tool sprawl.
- Captured story – a replayable path that others can follow, reuse, and improve.
This isn’t about being strict for its own sake. It’s about respecting how attention actually works when you’re reading production data under pressure.
Take the first step
You don’t need a full process overhaul to start working this way.
For your next production bug or tricky support ticket:
- Write a single, specific intent at the top of your doc or tool.
- Pick one surface to hold the whole investigation.
- Commit to a linear trail: one path, one story.
If you want a tool that’s built around this style of work, try pointing Simpl at your production (or read-replica) database and running your next incident from there.
One intent. One surface. A calmer way to understand what actually happened.