The Anti-Workspace: Why Fewer Panels Make Database Debugging Easier

Most database tools assume that more surface area means more power.
More panels. More tabs. More modes.
When you’re quietly trying to understand a broken user journey or a production incident, that surface area turns into something else: drag. You’re not just debugging the system; you’re debugging the workspace you built to look at it.
The anti‑workspace is the opposite stance: instead of assembling a cockpit of dashboards, consoles, and inspectors, you deliberately shrink the interface. One primary view. One query surface. One trail.
Tools like Simpl are built around this idea: an opinionated, read‑only database browser that favors a calm, single‑pane experience over a wall of widgets.
This isn’t an aesthetic preference. It’s a reliability decision.
Why this matters for real debugging
Database debugging is usually not about raw SQL skill. It’s about holding a story in your head:
- What the user did
- What the system claims it did
- What the data actually shows
Every extra panel competes with that story.
When you juggle:
- A BI dashboard
- A SQL IDE
- A log viewer
- An admin console
- A notebook with “scratch” queries
…you’re not just context‑switching tools. You’re context‑switching mental models. Each tool has its own filters, naming, and notion of “state.”
Research on multitasking and context switching has been clear for years: switching tasks frequently can cost 20–40% of your effective time, mostly due to re‑orientation overhead. That cost applies directly when you’re bouncing between panels to debug a single issue.
We explored this from another angle in Cognitive Load as a Feature: Why Database Tools Should Optimize for Fewer Decisions: every extra choice is a tax. Panels are choices, even when you’re not clicking them. They’re invitations to “just check one more thing.”
The anti‑workspace approach asks a different question:
What is the minimum surface you need to move from alert → understanding → decision?
Then it removes everything else.
What “too many panels” actually costs you
Panels feel helpful because they show more at once. The cost is more subtle.
1. Fragmented time
You rarely stay in one place long enough to see the full story. Instead you:
- Notice a metric spike in a dashboard
- Alt‑tab into a SQL editor
- Open an admin tool to check a user
- Skim logs in another tab
- Jump back to the dashboard to see if it “looks better now”
Each hop is a small reset of context. You re‑scan the UI, re‑locate the relevant bit, and re‑assemble the narrative.
2. Competing truths
Different panels often disagree:
- A dashboard shows a smoothed metric
- A direct query shows raw events
- A log viewer shows partial failures
All are “true” in their own way. But when they’re visible at once, you spend attention reconciling them instead of following a single, grounded trail through the data.
3. Risk by proximity
When the panel that lets you read production data lives next to the panel that lets you change it, you’ve increased the blast radius of a tired click.
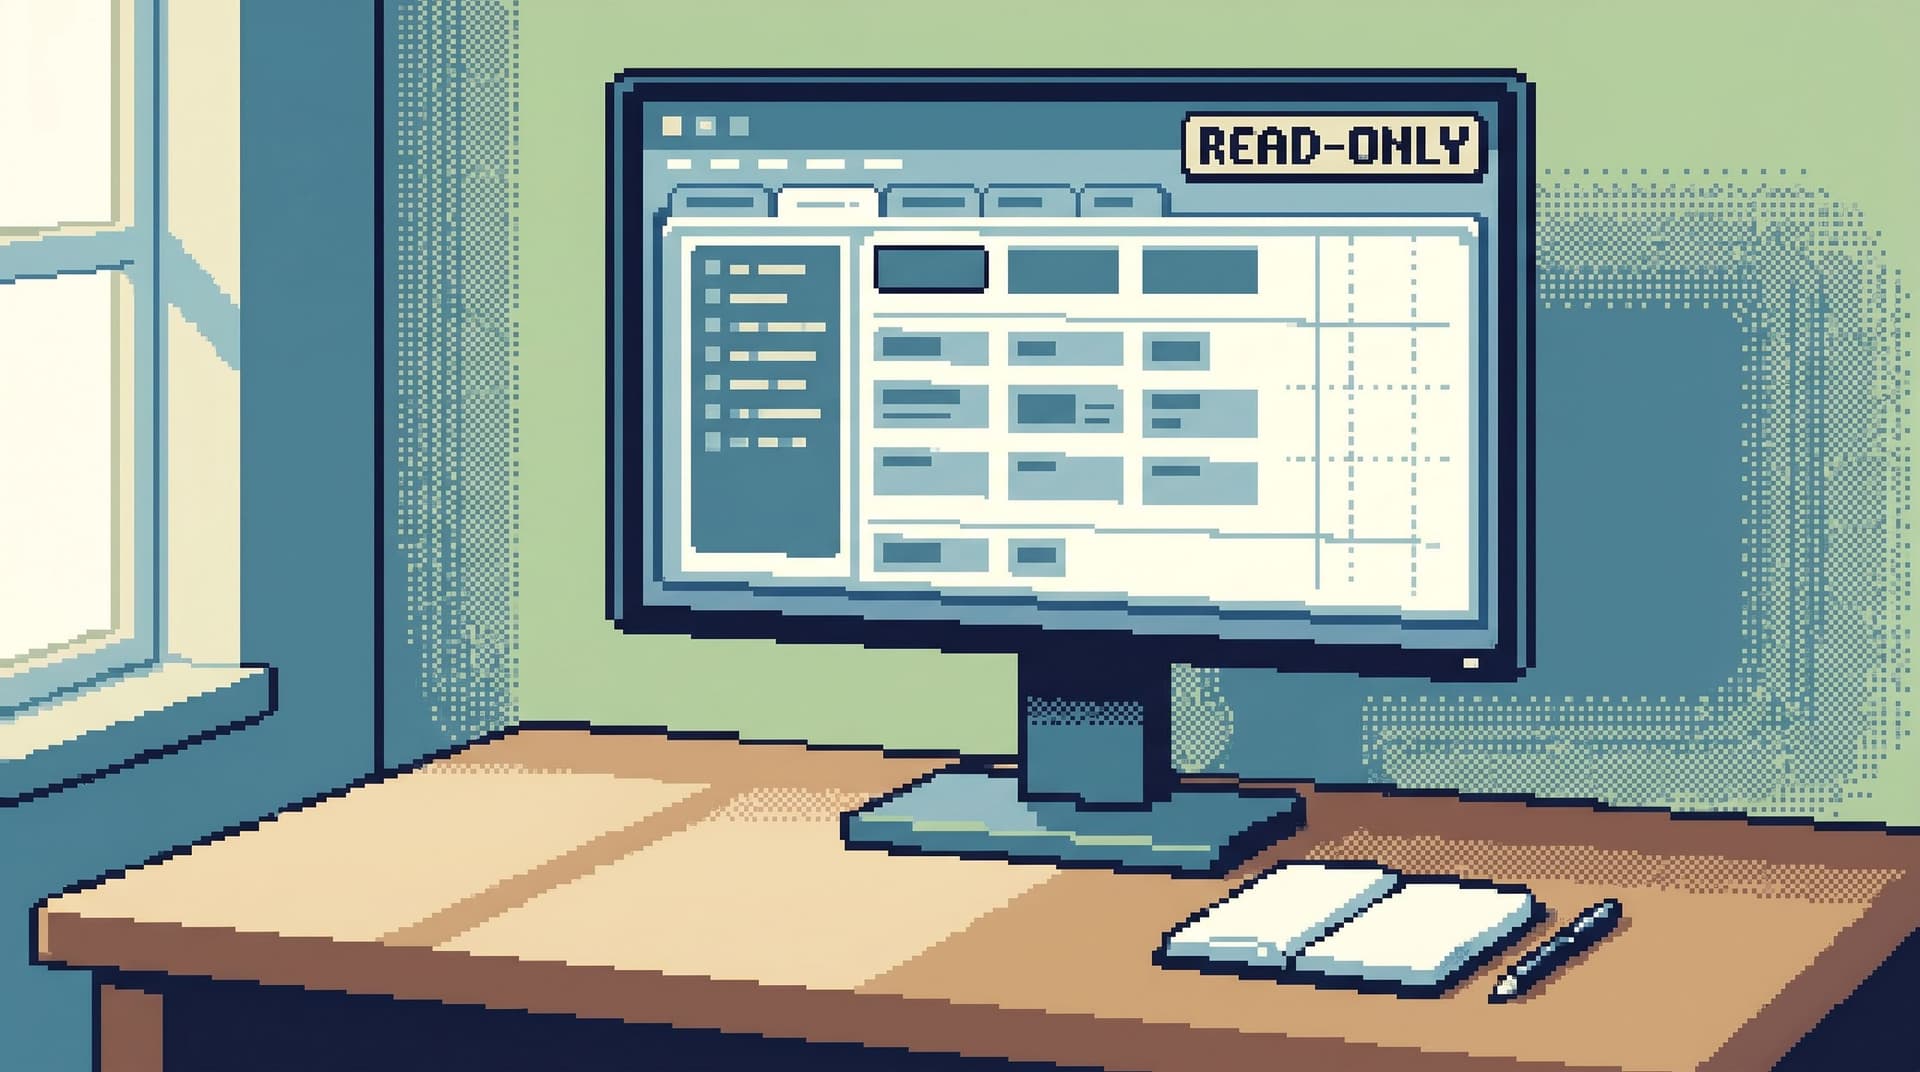
This is one reason Simpl is read‑only by design: you shouldn’t be one misclick away from a destructive action while you’re in a debugging mindset. We go deeper on this stance in Opinionated Read‑Only by Design: Why Simpl Refuses to Become Your Admin Panel.
4. No single trail
With many panels, your investigation becomes a scatter plot of actions:
- A query here
- A filter change there
- A dashboard drill‑down somewhere else
When the incident is over, there’s no clear path to replay. Future you — or another engineer — can’t follow the steps that led to the insight. The work doesn’t compound.
The anti‑workspace favors one coherent trail over parallel, half‑remembered paths.
The anatomy of an anti‑workspace
An anti‑workspace is not about using fewer tools across your entire job. It’s about how you set up the environment for a specific debugging session.
Think of it as a small design spec for your next incident or deep‑dive:
- One primary window
- One primary data source (usually your production or replica database)
- One primary tool (a calm browser like Simpl, not a full admin console)
- A strict limit on panels and tabs inside that tool
Within that constraint, you make the tool work harder so your brain works less.
Key characteristics:
- Single focus area – One main table/query view, not three side‑by‑side grids.
- Context on demand – Lightweight ways to peek at related rows or tables without opening a new world.
- Linear history – A visible trail of the queries or views you used, instead of a pile of unnamed tabs.
- Opinionated read‑only posture – No write controls, no “quick fix” buttons.
Designing your own anti‑workspace
You don’t need to rebuild your stack to get the benefits. You can start with how you work during one debugging session.
1. Declare a single home base
Pick one interface to be “home” for the session.
For many teams, that should be a focused database browser like Simpl or a stripped‑down SQL client pointed at a read‑only role.
Make a clear rule:
- All truth claims go through home base.
Dashboards and logs can suggest hypotheses. The database confirms them.
2. Collapse panels into sequences
Instead of:
- Logs on the left
- Database in the middle
- Dashboard on the right
…treat them as steps, not neighbors.
A simple pattern:
- Start from the alert or ticket
- Use logs only to identify concrete keys (user ID, order ID, job ID)
- Move into your database browser and stay there as long as possible
- Use dashboards only at the end, to confirm that the fix changed the right shape of behavior
If a panel doesn’t help you move to the next step, close it.
3. Limit yourself to two views at a time
Inside your primary tool, impose a hard rule:
- At most two simultaneous views of data.
For example:
- Current user row
- Related events or orders
If you need a third view, replace one of the existing ones instead of adding another panel.
This forces you to choose what actually matters for the current question.
4. Favor trails over tabs
Tabs feel comforting, but they encourage hoarding: “I might need this later.”
A calmer pattern is a trail:
- Each query or view is a step in a linear history
- You can move back and forward along the trail
- You can name or annotate important steps
This is one of the core ideas behind Post‑Saved‑Query Workflows: How Opinionated Trails Replace Personal SQL Stashes: the goal is to leave behind a path, not a junk drawer of tabs.
If your current tool doesn’t support trails, you can approximate them:
- Keep a small notes doc next to your main window
- Paste each important query or observation in order
- Add a one‑line explanation: “Step 3: Verified user had two active subscriptions before migration.”
It’s low‑tech, but it keeps the story linear.
5. Separate “map reading” from “story reading”
Sometimes you do need a schema diagram or data catalog. The anti‑workspace doesn’t ban that; it separates it in time.
When you’re:
- Learning a new domain
- Designing a feature
- Planning a migration
…that’s map‑reading work. Use richer tools, diagrams, and schema browsers.
When you’re:
- On an incident call
- Debugging a specific user issue
- Answering a concrete “what changed?” question
…you’re reading a story. For that work, you want the calm, thin surface we describe in The Calm Schema Surface: Showing Just Enough Structure for Everyday Production Reads.
Don’t mix the two in the same workspace.
6. Use read‑only as a design constraint
The moment your debugging workspace can mutate production, you invite a new class of mistakes:
- “I thought I was in staging.”
- “I only meant to change one row.”
- “I didn’t realize that button did a write.”
The anti‑workspace assumes:
- No writes from the debugging surface.
Changes happen elsewhere, in tools designed for writes, with their own guardrails and rituals.
This is where Simpl fits cleanly: it’s intentionally not your admin panel. It’s the place you go to read production data with confidence that nothing you click will change it.
A concrete pattern: the one‑window debug session
Let’s make this tangible. Imagine you’re on call. A ticket comes in:
“User 48291 says their subscription was canceled and then reactivated overnight, and they were double‑charged.”
Here’s how an anti‑workspace session might look.
Step 1: Open one window
- Single browser window.
- One tab: your database browser (e.g., Simpl) pointed at your production read replica.
- Optional: a small notes doc split‑screened, if you like to write as you go.
No dashboards yet. No admin tools. No notebooks.
Step 2: Anchor on a single key
From the ticket or logs, extract one anchor:
user_id = 48291
In your browser:
- Navigate to the
userstable - Filter by
id = 48291 - Pin this as your primary view
Everything else you do should relate back to this anchor.
Step 3: Walk the minimal path
Ask: “What is the shortest path from this row to the billing events that matter?”
For example:
- From
users, open relatedsubscriptionsfor this user - From
subscriptions, open relatedinvoicesorpayments - Look at timestamps around the reported incident window
Keep to your two‑view rule:
- View A:
usersrow - View B: whichever related table you’re currently inspecting
If you need to change B (e.g., from subscriptions to invoices), replace it instead of opening a third panel.
Step 4: Record the trail, not the workspace
As you move:
- Note each key query in your trail (built‑in history or your notes doc)
- Add 1–2 words of context: “Check active subscriptions before 03:00 UTC”
You’re leaving behind a replayable story:
- User row
- Subscriptions before incident
- Subscriptions after incident
- Invoices around the same time
Step 5: Only then, check the panels
Once you have a clear narrative from rows:
- “Subscription was canceled at 02:13 UTC by job X, then re‑created at 02:14 UTC with plan Y.”
…you can briefly open your dashboards to:
- Confirm that this pattern isn’t widespread
- See if similar anomalies cluster in time
But this is a confirmation step, not the core of the investigation.
Then you close the dashboards and return to your one‑window home base.
Making the anti‑workspace a team habit
An anti‑workspace only works if it becomes a shared expectation, not just a personal quirk.
A few ways to socialize it:
- Write a short runbook – “For production data debugging, we use one primary browser, one window, one trail.” Keep it to one page.
- Pair on incidents – Practice the pattern together. One person drives, the other narrates the story and enforces the “no extra panels” rule. (We explore this dynamic more in The Calm Pair‑Query: How Two‑Engineer Sessions Change Production Database Culture.)
- Bless a single tool – Choose one primary read‑only browser (like Simpl) and make it the default for production reads.
- Review trails, not screenshots – After incidents, look at the query trail instead of a pile of screenshots or Slack snippets. Ask: “Could someone else replay this story?”
Over time, you’ll notice a cultural shift:
- Fewer heroics, more repeatable patterns
- Less “where do I look?” and more “what’s the next step in the story?”
- Debugging sessions that feel quiet, even when the stakes are high
Summary
The anti‑workspace is a simple idea:
Fewer panels. One primary tool. A single, linear trail through your data.
For database debugging, that simplicity compounds:
- Lower cognitive load – You spend attention on the data, not the UI.
- Less risk – Read‑only, single‑purpose tools like Simpl keep writes and dangerous actions out of the picture.
- Clearer stories – Linear trails make incidents replayable and teachable.
- Stronger habits – Teams converge on a shared way of looking at production, instead of a personal sprawl of workspaces.
You don’t need to throw away your existing tools. You just need to be more opinionated about how many of them are allowed into a single debugging session.
Take the first step
You can start small, today:
- Pick one focused, read‑only database browser — something like Simpl.
- Run your next incident or tricky bug from one browser window and a simple trail of queries.
- Afterward, ask: “What did we miss by not having more panels?” and “What did we gain?”
Chances are, you’ll find that the missing panels weren’t doing as much work as you thought.
And once you’ve felt a calm, single‑pane debug session, it’s hard to go back to a wall of glass.