From Dashboards to Drilldowns: Why Engineering Teams Need a Different Kind of Data Tool

Dashboards were supposed to make data feel simple.
At first they did. A few charts, a couple of key metrics, a shared place to look.
Then the charts multiplied. Teams added more panels “just in case.” Every new product question, every incident, every stakeholder request turned into another tile. Over time, the wall of dashboards stopped clarifying reality and started obscuring it.
For engineering teams, that’s where the friction starts.
Most of the work engineers do with data isn’t “monitor this metric forever.” It’s:
- Debug a specific user issue
- Trace a job through multiple services
- Validate an assumption before a deploy
- Understand what really happened during an incident
Those are drilldown problems, not dashboard problems.
You don’t need more charts. You need a calmer, more opinionated way to move from “something looks off” to “I understand what happened in the data.”
Tools like Simpl exist for exactly this gap: a focused database browser that gives engineers a quiet, streamlined interface for exploring and understanding data—without becoming another BI cockpit or admin console.
Dashboards Are Great at the Wrong Things
Dashboards do a few things very well:
- Broadcasting: share a stable set of metrics with a broad audience
- Monitoring: watch for known failure modes and trends
- Reporting: answer recurring, top-level questions (“How many signups yesterday?”)
They are much worse at the things engineers need during real work:
- Narrative: “What actually happened to this user over the last 24 hours?”
- Causality: “Did this deploy change behavior, or is the dashboard lying?”
- Exploration: “What’s going on in this weird corner of the system?”
When teams try to stretch dashboards into investigative tools, a few patterns show up:
- Chart sprawl: dozens of panels, each added to answer a one-off question
- Metric drift: slightly different definitions of “active user” or “error rate” across dashboards
- Context loss: no clear trail from the chart to the underlying data and events
We’ve written before about this in The Case for Fewer Charts: Building Database Tools That Show Just Enough. The short version: more visuals don’t automatically mean more understanding.
Dashboards are good at summaries. Engineering work often demands stories.
Drilldowns Are Where Real Engineering Decisions Happen
When something breaks, you rarely say, “Show me every metric we have.”
You say things like:
- “Why did this user get charged twice?”
- “Why did this job retry 50 times and then disappear?”
- “Why are events missing for this cohort in one region?”
Those questions:
- Cut across multiple tables and services
- Span time (before, during, after an event)
- Depend on subtle relationships and edge cases
They require drilldowns:
- Start from a concrete anchor (user, job, order, trace ID)
- Walk through related rows and events
- Compare “expected” vs “actual” behavior
- Capture enough context to explain what you found
Dashboards can hint that “something is wrong.” They almost never give you the complete story.
A different kind of tool is needed here: not a wall of charts, not a blank SQL editor with admin powers, but a calm, narrative-friendly way to:
- Move from entity to entity
- See related data in a coherent sequence
- Stay grounded in real rows, not just aggregates
That’s the gap a focused database browser like Simpl is designed to fill.
Why Engineering Teams Outgrow Dashboard-First Thinking
Most teams don’t notice this gap until a few things start to hurt.
1. Incidents take longer than they should
During an outage, the instinct is to open everything:
- Metrics dashboards
- Log search
- Traces
- Ad-hoc SQL
Everyone is staring at different slices of the system. Nobody is actually walking a single story through the data.
A calmer pattern looks more like what we described in Incident Triage Without the Firehose: pick a narrow path, follow it deeply, and only widen the view when you have to.
That’s hard to do if your only tools are:
- Dashboards tuned for broad monitoring
- General-purpose SQL clients tuned for power users
You need a middle layer that’s built for investigation.
2. Debugging becomes a team sport for the wrong reasons
When the only way to understand data is to:
- Share a live screen of a dashboard
- Paste raw SQL into Slack
- Walk someone through a half-remembered query
…you end up pulling more people into the room than the problem really needs.
The missing piece is a tool that:
- Lets one engineer build a clear trail through the data
- Makes that trail easy to share and replay
- Keeps the context attached to the queries and results
That’s the idea behind “read trails” and async debugging in posts like Read Trails, Not Logs: Turning Database Sessions into Shareable Narratives and Async Debugging: How to Share Database Context Without Spinning Up a Meeting.
3. Schema complexity leaks into every question
Dashboards hide schema complexity behind metric names—until you need to understand why a number moved.
Then you’re back to:
- Guessing which tables matter
- Re-learning join conditions
- Reconstructing how events, jobs, and users relate
Most tools drop you into a tree of tables and a blank editor. As we argued in Less Schema, More Story: Helping Engineers Navigate Databases by Use Case, Not Object List, that’s the wrong starting point for real work.
Engineers need tools that:
- Start from use cases and entities, not from table lists
- Guide them through opinionated read paths
- Keep the mental model small, even when the schema is large
What a “Drilldown-First” Tool Should Actually Do
If dashboards are for monitoring, and BI tools are for reporting, what should a tool for engineers actually optimize for?
Here’s a practical checklist.
1. Start from entities, not metrics
An engineering-friendly data tool should make it trivial to anchor on:
- A specific user
- A job or task ID
- An order or transaction
- A trace or correlation ID
From there, it should:
- Show the key attributes of that entity
- Surface related events, jobs, and changes
- Let you move sideways (to related entities) without losing the thread
This is where opinionated read paths matter. Tools like Simpl are built to turn “search for user X” into a calm, guided view of everything relevant about that user—without dumping the entire schema on you.
2. Make drilldowns linear and legible
Most GUIs encourage tab explosions:
- One tab per query
- One tab per table
- One tab per “just in case I need this later” view
A better pattern is closer to a single trail:
- One main window
- One visible step at a time
- A clear history of how you got from A → B → C
We explored this idea in The Single-Window Database Session: Structuring Deep Work Without Tabs, Panels, or Overlays.
For drilldowns, this matters because:
- You can replay your own reasoning
- You can share the trail with others
- You avoid losing context in a forest of tabs
3. Treat raw data as the source of truth, not a last resort
Dashboards are one or two layers removed from reality:
- Aggregated
- Sampled
- Sometimes cached
For engineering work, you often need to see actual rows:
- The exact events around a failure
- The precise values that triggered a bug
- The history of changes to a record
A drilldown-first tool should:
- Make it easy to move from metric → sample → raw rows
- Keep the raw view readable and scoped
- Help you compare “expected vs actual” without writing complex SQL every time
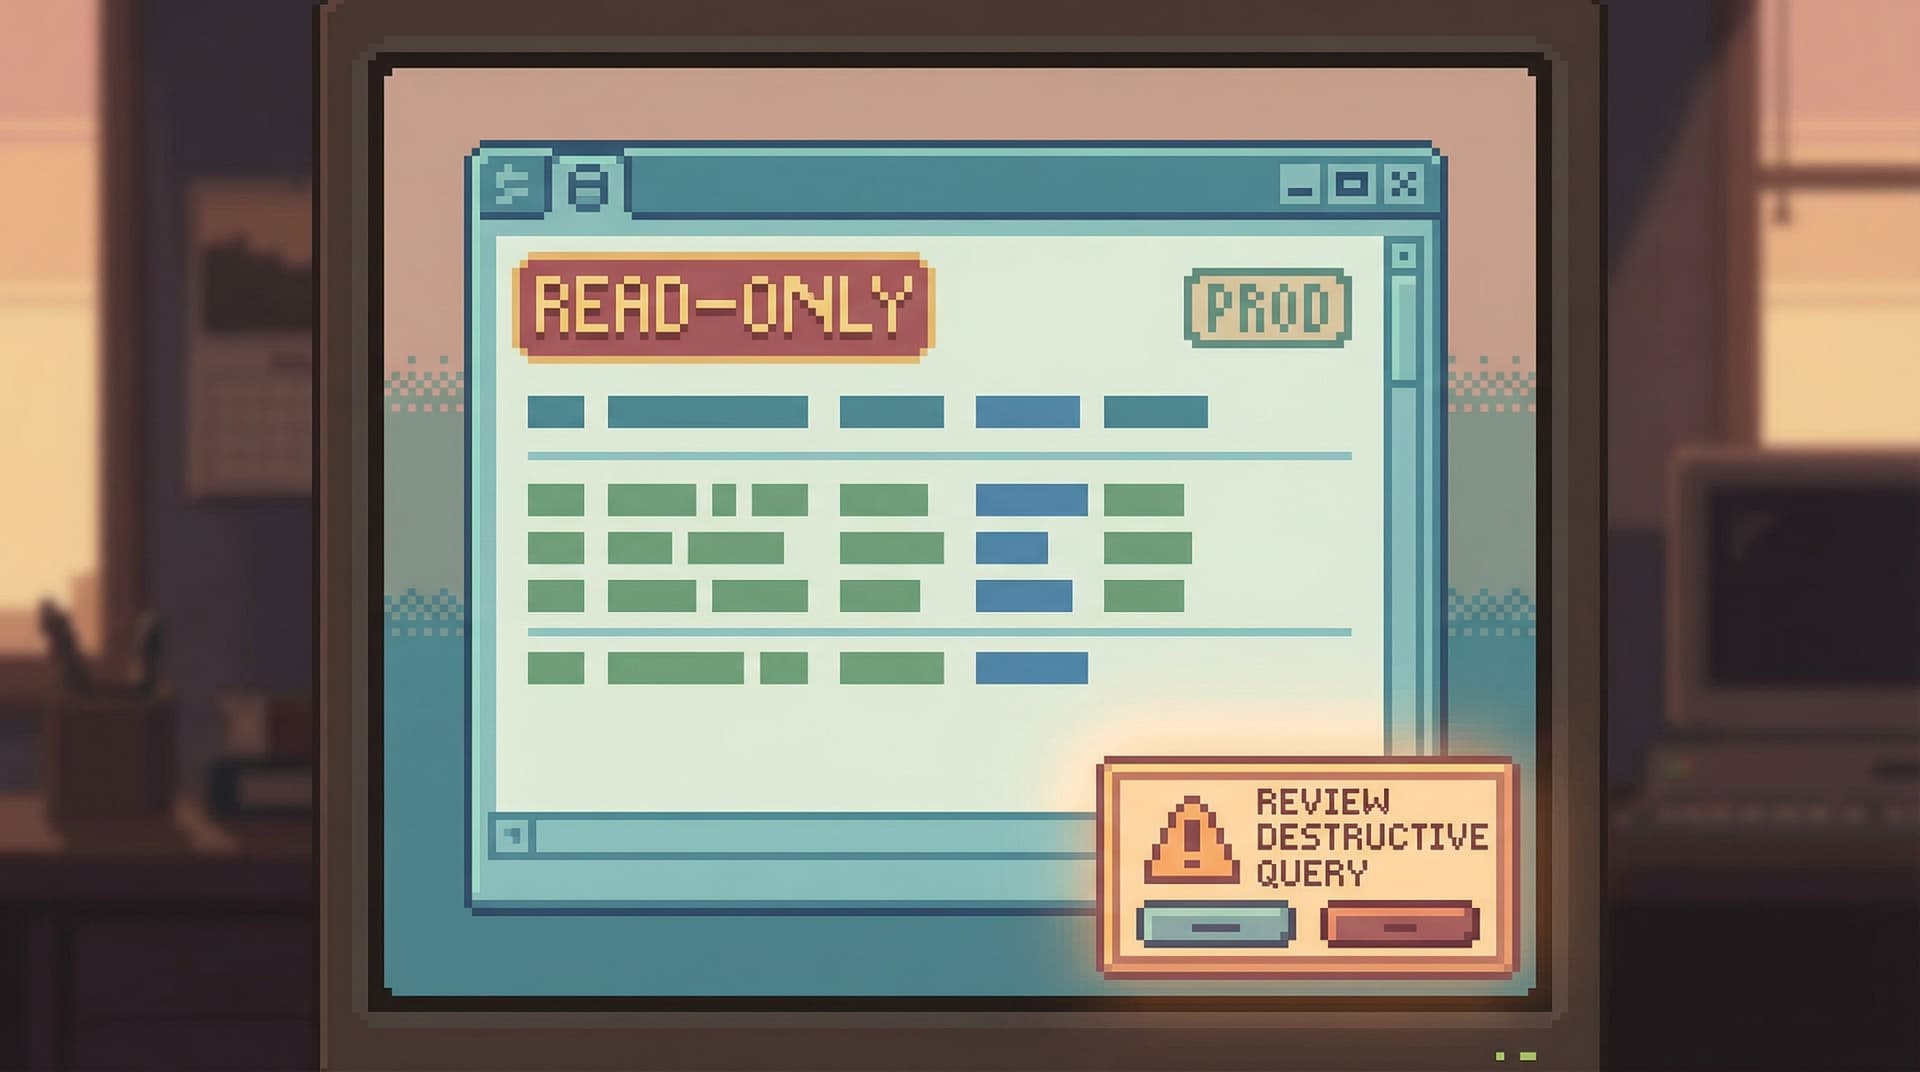
4. Be safe by default
Most SQL clients assume you’re an expert and give you near-admin powers by default.
For production data, that’s not just noisy—it’s dangerous.
A tool built for engineering drilldowns should:
- Be read-only by default
- Make destructive actions rare and visually distinct
- Encourage patterns that are safe to repeat during incidents and migrations
We’ve written more about this in posts like Read-Only by Default: Building Safer Production Database Workflows Without Slowing Engineers Down and Calm by Default: UX Patterns That Make Dangerous Database Actions Feel Rare and Deliberate.
Simpl bakes these ideas into its core: opinionated read paths, single-window sessions, and guardrails that make exploration feel safe instead of fragile.
How to Move Your Team From Dashboards to Drilldowns
You don’t have to throw away dashboards. You just have to stop pretending they’re enough.
Here’s a practical way to evolve your stack.
Step 1: Decide what dashboards are for (and what they aren’t)
Make the role of dashboards explicit:
-
Keep dashboards for:
- High-level health metrics
- Business KPIs
- Known, repeatable questions
-
Stop using dashboards for:
- Deep debugging
- Edge-case investigations
- Explaining complex user journeys
Write this down. Put it in your runbooks. Make it clear that “the dashboard looks weird” is a starting signal, not the whole investigation.
Step 2: Define your standard drilldown questions
Collect the questions your team actually asks when debugging:
- “What happened to this user?”
- “What happened to this job?”
- “What happened during this deploy window?”
For each, sketch the ideal path:
- Where do you start? (ID, email, job ID, trace ID)
- Which tables or services do you need to touch?
- What does “done” look like? (What do you need to know to be confident?)
This gives you a blueprint for the opinionated read paths you’ll want in your tools. It’s the same mindset we described in Quiet by Constraint: Using Opinionated Read Paths to Tame Production Data Chaos.
Step 3: Introduce a calm, drilldown-friendly tool
If your only options today are:
- A heavyweight BI platform
- A general-purpose SQL client
…you’re forcing engineers to choose between:
- Too high-level
- Too low-level (and too risky)
This is where a focused browser like Simpl fits:
- Read-first, opinionated interface
- Single-window sessions that keep investigations linear
- Built-in patterns for user-centric and job-centric drilldowns
You don’t have to roll it out to everyone at once. Start with:
- On-call engineers
- People who regularly debug production issues
- Folks who are already “the data person” on their team
Step 4: Make trails, not screenshots
Change how you share findings:
- Instead of screenshotting dashboards, share a link to a replayable trail
- Instead of pasting raw SQL, share a structured investigation
- Instead of re-running the same queries from scratch, reuse prior trails as templates
This is where tools that support read trails (like Simpl) turn one-off investigations into reusable assets. Over time, your team builds a library of calm, repeatable drilldowns.
Step 5: Bake drilldowns into your incident and migration playbooks
Update your runbooks so they:
- Point from each alert to a standard drilldown path
- Include links to canonical trails for common failure modes
- Treat dashboards as “early warning,” not “final answer”
During migrations or major schema changes, lean on calmer tools instead of the loudest ones. We’ve seen this make a real difference in scenarios like those described in The Quiet Migration: Using Calm Database Tools During Schema and Service Changes.
The Payoff: Quieter, Faster Engineering Work
Moving from dashboards to drilldowns isn’t about adding yet another tool. It’s about changing how you think about data work.
When engineering teams have a dedicated, drilldown-first interface to their databases, a few things happen:
-
Incidents resolve faster
- Less time staring at noisy charts
- More time walking clear, repeatable paths through real data
-
Debugging becomes calmer
- Fewer “everyone pile into a call” moments
- More async, narrative investigations you can read after the fact
-
New engineers ramp faster
- They follow established trails instead of memorizing schema trivia
- They learn how the system behaves through stories, not just diagrams
-
Risk goes down without slowing anyone
- Read-first, opinionated tools make safe exploration the default
- Dangerous actions feel rare, deliberate, and clearly distinct
Dashboards don’t go away. They just stop pretending to be something they’re not.
Where to Start
If this feels familiar—too many dashboards, too many tabs, not enough clarity—the next step doesn’t have to be big.
You can:
- Pick one or two common debugging questions (user issues, job failures, billing anomalies).
- Write down the ideal drilldown path for each.
- Try running that path in a calmer, drilldown-first tool like Simpl instead of your usual dashboard + SQL combo.
See how it feels:
- Does the investigation stay in one window?
- Do you end with a trail someone else can follow?
- Do you feel less anxious about touching production data?
If the answer is yes, you’ve found the shape of the tool your team has been missing.
Dashboards are for watching. Engineering is for understanding.
Give your team a way to drill down—quietly, safely, and with a clear story from start to finish.