The Calm Data On‑Call: A Minimal Workflow for Incident Reads at 2 a.m.


Being on call is rarely about heroics. It’s about attention.
At 2 a.m., you don’t have much of it.
You’re paged because something is wrong. Not abstractly wrong—concretely wrong for a set of customers, jobs, or payments. Metrics and traces tell you that something is off. But the real work starts when you have to answer a narrower question:
“What exactly is happening in the database right now, and who is affected?”
That’s incident reading. And it’s where most teams burn time:
- Jumping between dashboards, consoles, and ad‑hoc SQL
- Rewriting the same diagnostic queries from memory
- Copying screenshots into Slack because no one trusts links
- Getting lost in unrelated tables and data
A calm on‑call practice treats incident reads as a small, repeatable workflow—something you can do half‑awake without wandering.
This post is about that workflow: a minimal, opinionated pattern for reading your databases during incidents. We’ll assume you have observability in place (alerts, logs, traces). The focus here is what happens after the alert, when you open your database browser or a tool like Simpl and start reading rows.
Why incident reads deserve their own workflow
Incidents are not just “queries under pressure.” They have a few specific properties:
- They are narrow. One failing path, one user, one queue, one shard. Wide tools encourage the opposite.
- They are time‑bound. You’re not exploring. You’re stabilizing.
- They are collaborative. Even if you start alone, others will join. Your reads should be shareable.
- They are repeatable. Most incidents rhyme. The patterns of reads should, too.
When you treat incident reads as a first‑class workflow, a few benefits show up quickly:
- Shorter time to “what exactly is broken?” You get from metrics to rows without wandering.
- Less cognitive load on the person holding the pager. Fewer tools, fewer decisions.
- Better incident reviews. You have a concrete trail of what you looked at and why.
- Safer production access. Opinionated read paths make dangerous or noisy queries less likely.
If you want to go deeper on that bridge from alerts to concrete rows, you might like the earlier post “From Metrics to Rows: A Focused Workflow for Jumping from Alerts into Production Data”.
The 2 a.m. constraint: design for half‑awake
A good on‑call workflow assumes:
- You’re tired.
- You don’t fully remember the schema.
- You’re not the person who last touched this part of the system.
So the workflow has to:
- Start from the incident, not the database. You should not begin by hunting through table trees.
- Stay centered on one question. No wandering into unrelated data “just to check.”
- Use pre‑shaped paths as much as possible. Saved views, incident‑focused entry points, minimal query editing.
- Leave a trail. Others can join, replay, or extend what you’ve already done.
Tools like Simpl are built around that stance: opinionated paths, calm navigation, and production reads instead of open‑ended exploration. But the workflow itself is tool‑agnostic. You can implement the same ideas in whatever database browser you use.
A minimal 2 a.m. incident‑read workflow
Think of this as a four‑step loop:
- Anchor on one clear incident question
- Enter the database through a narrow incident path
- Walk a short, predictable sequence of reads
- Capture a quiet trail for handoff and review
Let’s walk through each step.
1. Anchor on one clear question
At 2 a.m., the worst thing you can do is open a console without a sentence in your head.
Before you touch the database, write down a single question that describes the incident from the system’s point of view. For example:
- “Why are checkout sessions created in the last 10 minutes not transitioning to paid?”
- “Which jobs in queue
billing_syncare stuck in retrying since 01:40?” - “Are US‑East users seeing more 5xx on
/loginthan other regions in the last 15 minutes?”
Make it specific:
- Scope: which entity (user, order, job, region)?
- Time window: when did this start?
- Symptom: what changed? status, count, latency, error code?
This question is your center. Everything you read in the database should serve it.
If you want more structure around this habit, “The Single‑Question Session: Designing Database Workflows Around One Clear Why” goes deeper into designing reads around that single sentence.
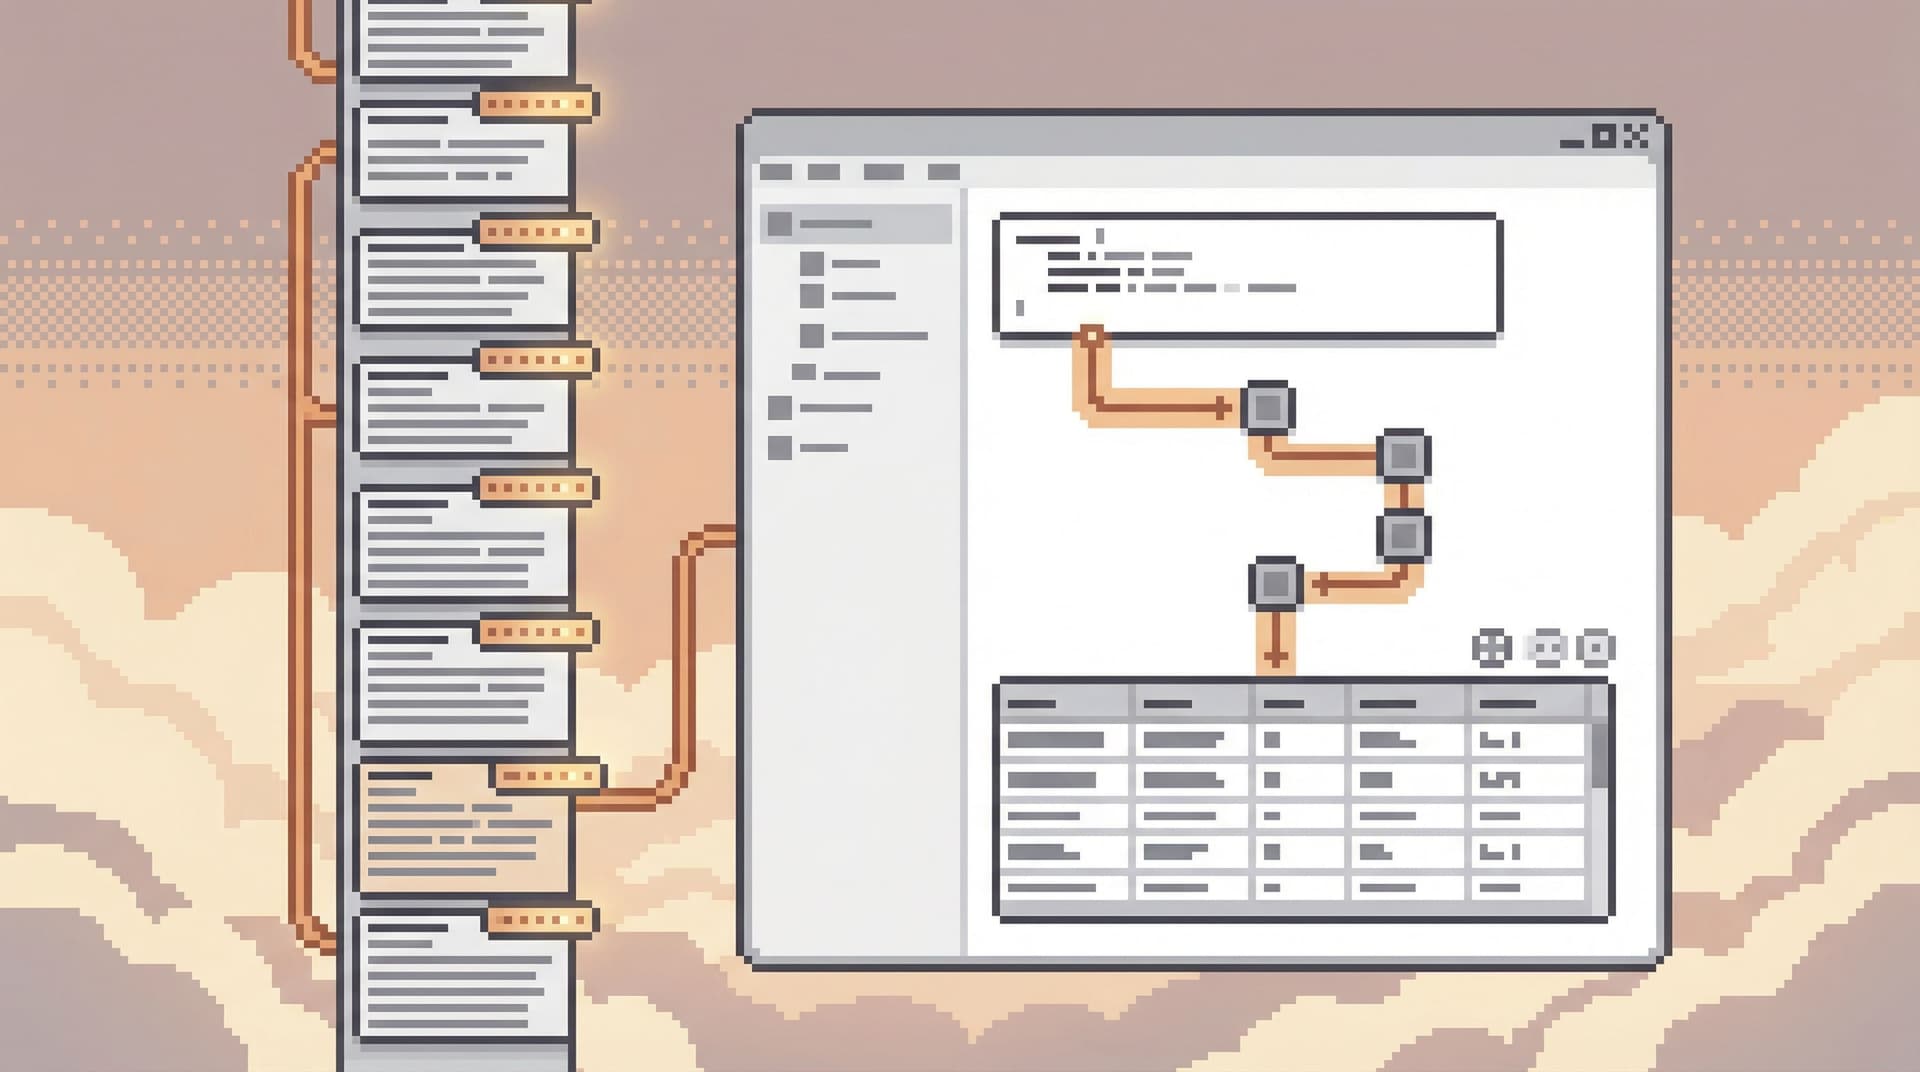
2. Enter through a narrow incident path
Once you have a clear question, resist the urge to start from a blank search bar or raw SQL editor. Those are great for exploration. They are terrible for calm incident work.
Instead, define one or two incident entry points into your database:
- A pre‑filtered view for your main incident entities (orders, jobs, sessions)
- A saved query that accepts a small number of parameters (time window, status, region)
- A link from your observability tool that jumps directly into a relevant view in Simpl or your browser of choice
For example, instead of:
“Open console → type
SELECT * FROM orders WHERE ...from memory.”
Prefer something like:
- “Open
Recent Checkouts (Incident)view → filter by last 15 minutes → filter bystatus != 'paid'.”
Or:
- “Click
View in DBfrom the alert → land on afailed_jobsview scoped to the queue and time window from the alert.”
The key properties of a good incident entry point:
- Narrow by default. Limited to the last N minutes or hours.
- Shaped around entities, not tables. “Checkouts,” “Sync Jobs,” “Payouts,” not
checkout_sessionsorjob_runsas raw tables. - Parameterizable, not editable. You tweak filters and inputs, not the structure of the query.
If your current database tools don’t support this kind of opinionated navigation, the post “Beyond Table Lists: Opinionated Navigation Patterns for Real‑World Production Reads” is a good design reference.

3. Walk a short, predictable sequence of reads
Once you’re inside a narrow incident view, your goal is not to “explore the data.” Your goal is to walk a short, repeatable sequence of reads that answers three questions:
- Is this incident real and ongoing?
- Who or what is affected, concretely?
- What is the most likely failing edge or transition?
A minimal pattern that works across many systems:
a. Confirm the shape of the incident
Use your incident view to validate that the alert matches reality:
- Filter by the time window from the alert.
- Filter by status or error code that describes the symptom.
- Sort by most recent first.
You’re looking for:
- A clear cluster of rows that match the symptom
- A clear “last good” row before things started failing
If you don’t see this, you may be looking at the wrong table, the wrong environment, or a flapping alert. Adjust before you go deeper.
b. Pick one concrete example row
Once you see the pattern, pick one representative row:
- A failing checkout
- A stuck job
- A user session with repeated errors
Open it in a focused detail view. Avoid joining everything at once. You want a calm, scoped view of:
- Key identifiers (user ID, order ID, job ID)
- Timestamps for creation, updates, and transitions
- Status fields and error codes
- Pointers to related entities (foreign keys, reference IDs)
This is where tools like Simpl shine: opinionated record views that make it easy to follow one entity’s story without drowning in columns.
c. Follow one step upstream and one step downstream
From that example row, you usually need just two more hops:
- Upstream: what created this entity, and what inputs did it receive?
- Downstream: what should have happened next, and did it?
In practice, that might look like:
- From a
checkout_session, jump to the payment attempt or cart items. - From a failing
job_run, jump to the job definition or previous successful run. - From a
login_attempt, jump to the user account and recent auth events.
The goal is not to build a full graph of everything connected to this row. The goal is to find the first edge where reality diverges from your expectations:
- A status that never transitions
- A timestamp gap that’s clearly wrong
- A missing related record that should always exist
If you want a deeper pattern for structuring incident reads around one failing path, “The Narrow Incident Browser: Structuring Production Reads Around One Failing Path” is a good companion.
d. Stop when you have a concrete story
You know you’re done with this loop when you can say a sentence like:
- “Checkouts created after 01:42 never create a payment attempt; the job that does that is no longer running in region
us‑east‑1.” - “Jobs in
billing_syncstarted failing at 01:37 withtimeouterrors; retries are piling up and no job has succeeded since then.”
This is enough to:
- Decide whether to roll back, fail over, or page another team
- File a ticket with concrete context
- Update incident comms with real impact
Then you either:
- Repeat the loop for another segment (different region, queue, or customer group), or
- Move to mitigation and handoff.
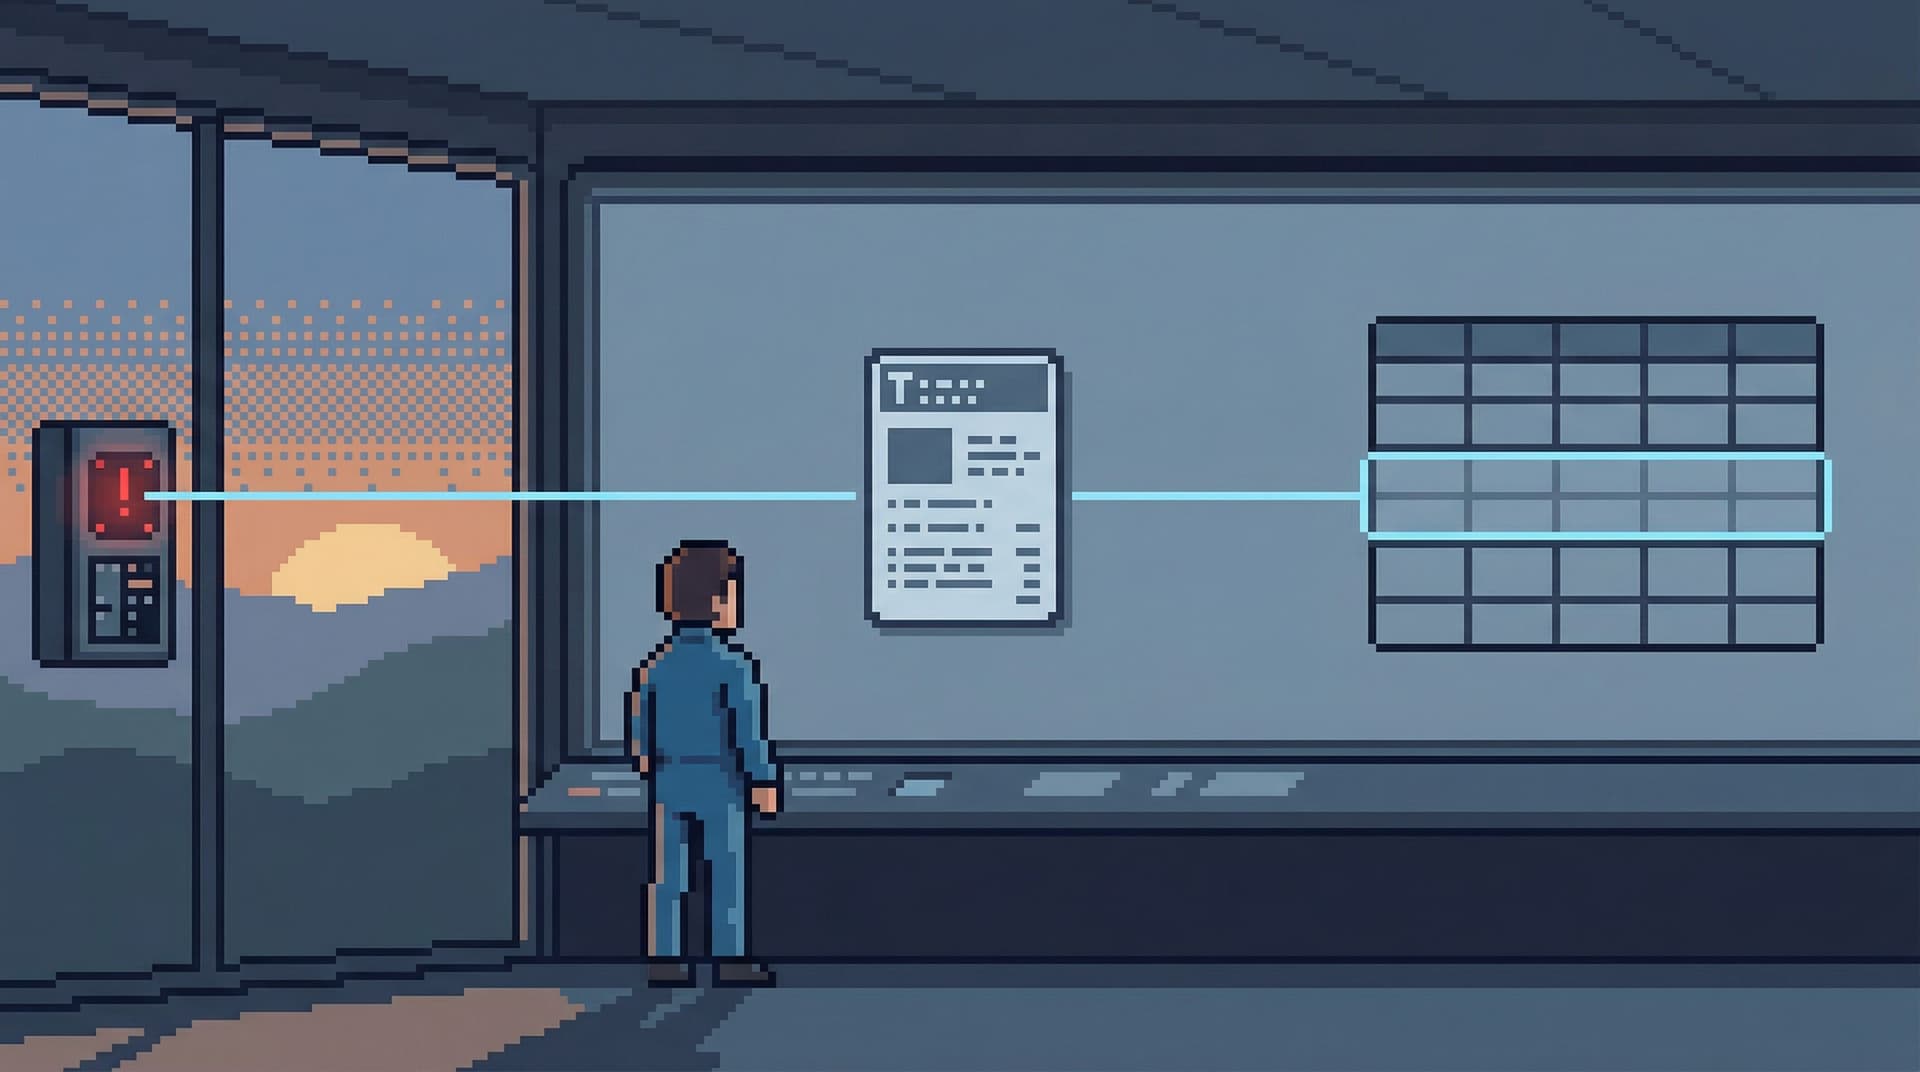
4. Leave a quiet trail: links, not screenshots
During incidents, context tends to fragment:
- Someone pastes a screenshot of a query result into Slack.
- Someone else rewrites the same query with a slightly different filter.
- A third person tries to reconstruct what happened during the review.
A calm on‑call workflow treats incident reads as assets, not just ephemeral actions.
A few simple practices help:
- Use shareable links into your database browser. If you’re using Simpl, this means sending links to specific views, filters, and record pages instead of screenshots.
- Name and save your best incident views. If you land on a particularly useful filter combination (“Stuck payouts in last 30 minutes, grouped by provider”), save it as an incident view for next time.
- Thread your reads. In your incident channel, reply to earlier links with updated ones, so people can follow the evolution of your understanding.
This is the same pattern described in “The Quiet Handoff: Sharing Production Database Context Without Screenshares or Zoom”: move from live walkthroughs to calm, link‑based handoffs.
Over time, these trails become a lightweight knowledge base:
- When a similar incident happens, you can reuse or adapt previous views.
- New on‑call engineers can follow past trails to learn how to read production calmly.
Designing your tools for calm incident reads
You don’t have to rebuild your stack to support this workflow. But a few design choices in your tools make it much easier.
1. Prefer opinionated read‑only roles.
Make sure your on‑call database access is read‑only, but also:
- Throttle or block obviously dangerous queries (full table scans at peak, unbounded joins).
- Encourage filtered, paginated reads by default.
The post “Opinionated Read‑Only Roles: How Access Design Shapes Everyday Database Work” goes into how these roles shape real work.
2. Treat incident views as first‑class.
In your browser or in Simpl:
- Create a small set of incident‑ready views for your core entities.
- Make them easy to discover from alerts, runbooks, and on‑call docs.
- Keep them narrow and tuned for on‑call use, not general reporting.
3. Integrate lightly with observability.
You don’t need a full integration project. Start with:
- Links from alerts to parameterized URLs in your database browser.
- A simple convention for including entity IDs in logs that match your incident views.
If you already invest in low‑noise logs, pairing them with calm query trails (as described in “Low‑Noise Logging: Pairing Query Trails with Application Logs Without the Firehose” at /low-noise-logging-pairing-query-trails-with-application-logs-wi) makes this even smoother.
4. Make the calm path the default path.
On call, people will follow the path of least resistance. Make sure that path is:
- A narrow incident view, not a blank editor
- A single‑question session, not an open‑ended data dive
- A shareable link, not a private terminal
Summary
A calm 2 a.m. on‑call workflow for incident reads is not about being clever. It’s about being deliberate.
- Anchor on one clear question before you touch the database.
- Enter through a narrow incident path—pre‑shaped views and saved queries, not blank editors.
- Walk a short, predictable sequence of reads: confirm the incident, pick one example row, follow one step upstream and downstream, stop when you have a concrete story.
- Leave a quiet trail of links and saved views so others can join, extend, and learn from your work.
- Shape your tools—or adopt a tool like Simpl—to make this calm path the easiest one to follow.
Done well, this doesn’t just make 2 a.m. less painful. It also makes 2 p.m. incident reviews clearer, onboarding smoother, and everyday production reads safer.
Take the first step
You don’t need a full incident‑console redesign to start.
This week, pick one service that pages you most often and:
- Write down the three most common incident questions you ask of its data.
- For each question, create one incident‑ready view in your database browser or in Simpl:
- Narrow time window
- Focused entity
- Minimal, clear filters
- Add links to those views into your runbook or on‑call docs.
The next time the pager goes off at 2 a.m., don’t open a blank console. Open one of those views instead.
Calm incident reads are not about more tools. They’re about fewer, better paths into the data you already have.