The Narrow Incident Browser: Structuring Production Reads Around One Failing Path

Incidents rarely fail everywhere at once.
They usually fail along one narrow path:
- A specific user’s checkout
- A single background job run
- One shard, one region, one queue
Yet most teams still debug these narrow failures from wide tools: full SQL IDEs, admin panels, and BI suites. Everything is visible, everything is editable (or feels like it), and every table is one click away.
This is how a simple incident turns into a maze of tabs, screenshots, and half‑remembered queries.
A narrow incident browser is a different stance: structure your production reads around one failing path, and make it hard to wander away from it.
Simpl exists for exactly this kind of work: calm, opinionated production reads instead of open‑ended exploration. A narrow incident browser is one of the core patterns behind that stance.
Why narrow matters when everything feels urgent
During an incident, your attention is the scarce resource.
Every extra table, every extra dashboard, every extra query path is:
- More cognitive load – You’re parsing schemas instead of understanding the failure.
- More risk – Wide, unbounded reads against hot tables at the worst possible time.
- More drift – People on the call quietly diverge to different queries and tools.
A narrow incident browser pushes in the opposite direction:
- One failing path at the center – “This user’s order through checkout,” not “orders table.”
- Pre‑shaped read rails – A small set of opinionated queries you can walk in sequence.
- Context that follows the path – Logs, events, and related entities, but only as they relate to this path.
If you’ve explored opinionated read paths before, this builds directly on the ideas in “Designing Read Rails: How Opinionated Query Paths Reduce Risk and Cognitive Load”. A narrow incident browser is what those rails look like under real pressure.
The mental model: one failing path, one pane
Think less “tool” and more “lens.”
A narrow incident browser is structured around three simple ideas:
- Anchor – The concrete thing that failed
- Path – The minimal sequence of reads that explain the failure
- Trail – A replayable record of those reads, in order
1. Anchor: pick one thing that actually broke
The anchor is the specific object you’re debugging. Not a table, not a metric — a story:
- One
order_id - One
job_run_id - One
subscription_id - One
payment_intent_id
Everything else is derived from that.
You should be able to state the anchor as a sentence:
“We are following order 81273 from creation to refund.”
In a narrow incident browser, that anchor is:
- Visible at the top of the screen
- Stable for the entire session
- Reflected in every query and panel by default
You’re not “looking at the database.” You’re following this one thing.
2. Path: a small number of deliberate steps
Once you have an anchor, you define the path: a short sequence of questions that, if answered, explain the incident.
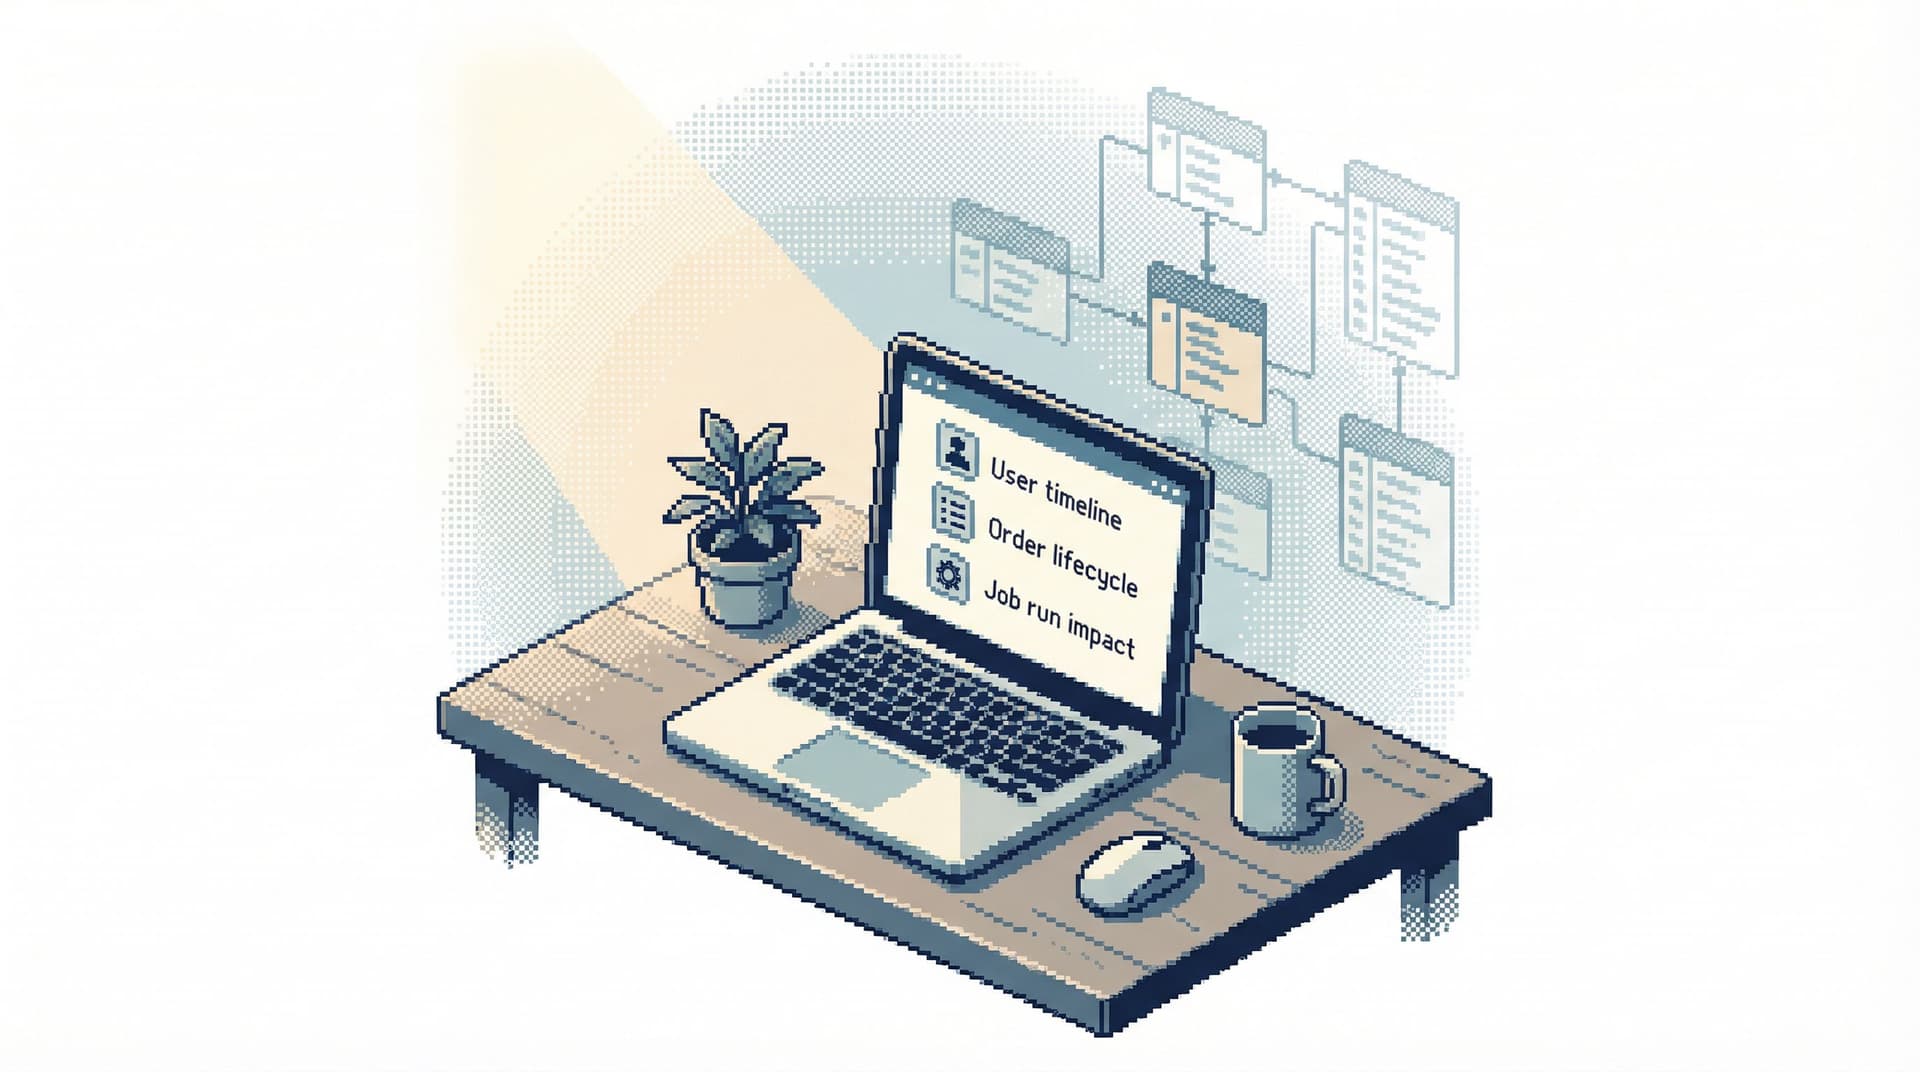
For an order stuck in checkout, that path might be:
- Did we create the order and all expected line items?
- Did we create a payment object, and what state did it reach?
- Did any background job touch this order (capture, refund, email)?
- Did we emit any error or retry signals tied to this order?
Each step maps to one or two pre‑designed queries or views, not ad‑hoc exploration.
This is where a tool like Simpl is opinionated by design: instead of exposing every table, you define calm, named query paths around real questions.
If you’ve worked with a calm catalog of questions instead of raw schemas, this will feel familiar. The same principle behind “The Calm Catalog: Mapping Production Tables to Real-World Questions, Not Schemas” applies here — but scoped to one live failure.
3. Trail: a single, linear record of what you saw
The output of an incident session shouldn’t be a pile of screenshots.
It should be a single, linear trail:
- Anchor:
order_id=81273 - Step 1: “Order + items” query, results snapshot, note
- Step 2: “Payment state” query, results snapshot, note
- Step 3: “Jobs touching order” query, results snapshot, note
- …
That trail is the basis for:
- A quick debrief right after the incident
- A later incident review
- Future on‑call rotations debugging similar failures
If this sounds like the “single query trail” pattern, that’s intentional; a narrow incident browser is the live counterpart of the ideas in “The Single-Query Incident Review: Replaying Outages from One Calm Data Trail”.

Designing the narrow incident browser
You don’t have to build a new product to get most of the value. You can redesign how you use existing tools — or adopt something like Simpl — around a few concrete constraints.
1. Start from the anchor, not the schema
The default entry point should never be “pick a table.” It should be “enter an anchor.”
Examples:
- A search box for
order_id,user_id, orjob_run_id - A deep link from your application or alerting system that pre‑sets the anchor
Once the anchor is set:
- Every query automatically filters to it
- Every panel uses it as the primary key
- Switching anchors is explicit and rare
Implementation ideas:
- In a SQL client, wrap your incident queries in templates that take a single parameter (
:order_id) and never run without it. - In Simpl, define a “debug order” question that always requires an
order_idbefore anything runs.
2. Pre‑shape the path as a small set of questions
For each common incident type, define 3–7 named steps.
Example: “Order stuck in pending payment”
- Order overview – Core fields, timestamps, status
- Line items – Items, quantities, prices
- Payment attempts – Provider state, error codes
- Background jobs – Any job that touched this order
- Integration events – Webhooks, outbound calls, retries
Each step is:
- A saved, parameterized query
- Named in the language of the incident, not the schema
- Designed to run cheaply against production (narrow filters, explicit limits)
You’re building read rails for incidents: clear, safe paths for on‑call engineers to follow without reinventing the investigation every time.
3. Keep navigation linear and local
The narrow incident browser should feel more like a story than a file explorer.
Concretely:
- No global schema tree in the main view
- No free‑form query editor by default during an incident
- Forward/backward navigation through steps, like a wizard
You can still allow an “escape hatch” into a full console, but it should be:
- Clearly marked as “advanced”
- Logged separately
- Rarely needed once your paths are mature
This is the same instinct behind the Anti‑Explorer stance: less wandering, more deliberate motion along a single path.
4. Make the trail first‑class
As you walk the path, the tool should automatically build a trail:
- Query name and parameters
- Result snapshot (or at least key fields)
- Optional short note: “Payment failed due to 3DS timeout.”
You should be able to:
- Share a link to the full trail with another engineer
- Attach the trail to an incident ticket
- Replay the trail later against a read‑only snapshot
This is how you avoid incident reviews that start with, “What did we actually look at?”
5. Put guardrails around expensive or noisy reads
Incidents are when teams are most likely to run dangerous reads:
SELECT * FROM events WHERE created_at > now() - interval '1 day'- Multi‑table joins without limits
- Repeated scans of hot partitions
Your narrow incident browser should:
- Refuse to run unscoped queries
- Enforce limits on wide tables by default
- Highlight “hot” tables with extra friction (confirmation, warnings)
This is where a focused tool like Simpl shines: you can design guardrails around actual production patterns instead of hoping people remember not to hit the big tables during traffic spikes.
A concrete example: one failing checkout
Let’s walk through a simple example.
Incident: A customer reports that checkout hung and they’re not sure if they were charged.
Anchor: order_id=81273
Path in the narrow incident browser:
-
Order overview
- Query:
SELECT id, user_id, status, created_at, updated_at FROM orders WHERE id = :order_id - Check: Was the order actually created? What’s the current status?
- Query:
-
Line items
- Query:
SELECT * FROM order_items WHERE order_id = :order_id ORDER BY id - Check: Do the items and totals match what the customer described?
- Query:
-
Payment attempts
- Query:
SELECT * FROM payments WHERE order_id = :order_id ORDER BY created_at - Check: Did we create a payment? What state is it in? Any provider error codes?
- Query:
-
Background jobs
- Query:
SELECT * FROM jobs WHERE payload->>'order_id' = :order_id ORDER BY created_at - Check: Did any capture/refund/email jobs run? Did they fail or retry?
- Query:
-
Integration events
- Query:
SELECT * FROM webhooks WHERE payload->>'order_id' = :order_id ORDER BY created_at - Check: Did we notify downstream systems? Any repeated failures?
- Query:
Trail outcome:
- Step 1: Order exists, status
pending, created_at T0 - Step 2: Items correct, total $120
- Step 3: Payment created, state
authorized, provider error: none - Step 4: Capture job enqueued but never executed (stuck in
queuedstate) - Step 5: No webhooks sent
Conclusion: The failure path is not “payment failed.” It’s “capture job never ran.” The fix is in the job system, not the payment provider.
The important part: you reached that conclusion without ever leaving the narrow path, and you have a replayable trail to attach to the incident ticket.
Making this real on your team
You don’t need to redesign your entire stack. You can introduce a narrow incident browser pattern incrementally.
Step 1: Choose one incident type
Pick a class of incidents that happens often enough to matter, but is narrow enough to model:
- Orders stuck in
pending - Subscriptions canceled unexpectedly
- Background jobs that never complete
For that one type, define:
- The anchor (e.g.,
order_id) - The 3–7 questions that always come up
Step 2: Turn those questions into named paths
For each question, create:
- A saved query or view
- A clear, human‑readable name
- A guarantee that it filters by the anchor
If you’re using Simpl, this is a natural fit for question‑centric views: “Show me everything that happened to this order,” “Show me all jobs that touched this subscription,” and so on.
Step 3: Wrap it in a simple UI
You don’t need a full product team.
A minimal implementation could be:
- A small web page that:
- Accepts an
order_id - Shows your 3–7 steps as tabs or a vertical list
- Runs the corresponding queries via your database browser or data API
- Accepts an
- A link from your alerting system or application that deep‑links into this page with the anchor pre‑filled
Over time, you can:
- Add the trail: store which steps were opened, with parameters
- Add notes: let on‑call engineers annotate what they found
- Add guardrails: prevent ad‑hoc, unscoped queries from this surface
Step 4: Make it the default during incidents
The hard part isn’t the tool. It’s the habit.
On your next on‑call rotation:
- Encourage people to start from the narrow incident browser, not the general SQL client.
- Keep the full console available, but treat it as a last resort.
- During the review, walk through the trail instead of reconstructing the incident from memory.
As this pattern sticks, you’ll notice something subtle: incidents feel less like “data dives” and more like structured reads. That same stance is at the heart of “Production Reads, Not Data Dives: Structuring Database Sessions Around One Clear Question”.
Why this makes incidents calmer
A narrow incident browser doesn’t just make people faster. It makes them calmer.
You reduce cognitive load.
The interface stops shouting “you can do anything” and starts quietly saying “here’s the next step along this path.”
You reduce risk.
Pre‑shaped, parameterized queries with limits are much safer than ad‑hoc reads against hot tables during peak traffic.
You create reusable knowledge.
Each incident produces a trail you can replay and refine, instead of vanishing into local query history. Over time, those trails become a living library of how your system actually fails.
You align tools with reality.
Engineers already debug incidents by following one failing path. A narrow incident browser simply makes the tool match that mental model.
Summary
A narrow incident browser is a calm way to debug production:
- Center everything on one anchor: a specific order, job, subscription, or payment.
- Walk a small, opinionated path of 3–7 steps that explain what happened.
- Capture a single, linear trail of queries, results, and notes you can replay later.
- Use guardrails and read rails to keep investigations safe and focused, especially under pressure.
Whether you build a lightweight in‑house surface or adopt a focused tool like Simpl, the principle is the same: structure production reads around one failing path, and make wandering the exception, not the default.
Take the first step
Pick one recurring incident type and design a narrow path for it.
- Write down the anchor.
- List the 3–7 questions you always end up asking.
- Turn those into named, parameterized queries with safe defaults.
- Wrap them in the simplest possible UI, or define them as question‑centric views in Simpl.
Run your next incident through that path. Notice how much less wandering there is.
From there, you can expand. One path at a time, one failing story at a time, until your incident tooling finally matches the way you already think about failures: narrow, specific, and calm.