From Stack Traces to Rows: A Calm Workflow for Debugging Incidents in Simpl

Incidents don’t resolve in dashboards. They resolve in rows.
A stack trace tells you where the code tripped. Logs tell you when it happened and with which inputs. But until you can calmly say, “these specific rows are wrong, for this specific reason,” you’re still guessing.
This post is about building a stable, repeatable path from stack traces and logs into the exact rows that matter—without turning every incident into a noisy scramble through consoles, dashboards, and ad‑hoc SQL.
Simpl exists for that middle layer: a calm, opinionated database browser that lets teams explore, query, and understand production data without the noise of full BI or admin tools. We’ll use it as the reference point, but the workflow applies broadly.
Why start from stack traces and rows?
Most incident workflows quietly split into two worlds:
- Code world: stack traces, logs, traces, error trackers, APM.
- Data world: SQL consoles, admin panels, BI, raw queries.
During an incident, people bounce between them:
- Grepping logs for a user ID.
- Copying that ID into a SQL client.
- Pasting query results into Slack.
- Re-running slightly tweaked queries when someone asks a new question.
It works. It’s also:
- Noisy — too many tools, too many tabs, too many partial views.
- Slow — every hop between tools is another mental context switch.
- Fragile — no single source of truth for “what we actually saw” during the incident.
A calm workflow does something different:
- Treats one failing path (one user, one job, one request) as the center of gravity.
- Moves from stack trace → structured incident context → focused production reads.
- Leaves behind a replayable trail anyone on the team can reuse.
If you’ve read about the “narrow incident browser” pattern, this will feel familiar. If not, you might enjoy The Narrow Incident Browser: Structuring Production Reads Around One Failing Path as a companion.
A calm mental model for incident debugging
Before the steps, it helps to name the shape of the work.
During a real incident, you’re usually answering variations of three questions:
-
What failed?
The stack trace, error message, or alert that pulled you in. -
Who or what is affected?
Specific users, orders, jobs, regions, or shards. -
What actually happened in the data?
The concrete rows that prove or falsify your theory.
Most confusion comes from trying to answer all three at once. A calm workflow separates them into stages.
We’ll walk through a concrete sequence:
- Stabilize the incident context from stack traces and logs.
- Translate that context into a small, repeatable “incident key”.
- Use Simpl to follow a narrow path from that key to rows.
- Turn the investigation into a shareable, replayable trail.
Step 1: Stabilize the incident context
Start where the incident started: the stack trace or error log.
Instead of reading everything, focus on extracting a small set of stable anchors:
- Primary entity: user ID, account ID, order ID, job run ID.
- Key timestamps: when the error first appeared, and when it last appeared.
- Code touchpoints: the specific service, endpoint, or job name.
A simple checklist:
-
From the stack trace / error event:
- [ ] Service or job name
- [ ] Endpoint or job type (e.g.,
POST /checkout,billing_reconciliation_job) - [ ] Error type and message
- [ ] Correlation ID or request ID (if present)
-
From logs / traces:
- [ ] User or account identifier
- [ ] Domain entity (order ID, subscription ID, invoice ID, etc.)
- [ ] Exact timestamps for the failing requests
Your goal is not to understand the whole incident yet. Your goal is to distill one failing path you can follow into the database.
If you can’t write down “this user / this order / this job at this time,” you’re not ready to open a database tool.
This is also where low-noise logging helps. If your logs already include stable identifiers that map cleanly into queries, the rest of the workflow becomes much simpler. If that’s not yet true for your team, see Low-Noise Logging: Pairing Query Trails with Application Logs Without the Firehose.
Step 2: Define the “incident key”
Once you’ve stabilized context, compress it into a single, shareable key.
An incident key is the smallest set of fields that:
- Uniquely identify the failing path.
- Can be used directly in queries.
- Are stable enough to share between tools and people.
Examples:
user_id = 48291andorder_id = 991288at2026-04-10T13:02Z.job_run_id = 7f4b-…forbilling_reconciliation_jobstarted at2026-04-09T23:00Z.request_id = req_abc123forPOST /api/v1/subscriptions.
Practically, that might look like a short snippet in your incident channel:
Incident key:
user_id=48291,order_id=991288, window2026-04-10 12:55–13:10 UTC.
This does two things:
- Gives everyone on the incident a shared handle for the problem.
- Defines exactly what you’ll search for once you open Simpl.
You can build small habits around this:
- Use a standard format for incident keys in Slack or tickets.
- Add a quick link from your error tracker (e.g., Sentry, Honeycomb, Datadog) to a pre-filtered view in your database browser using that key.
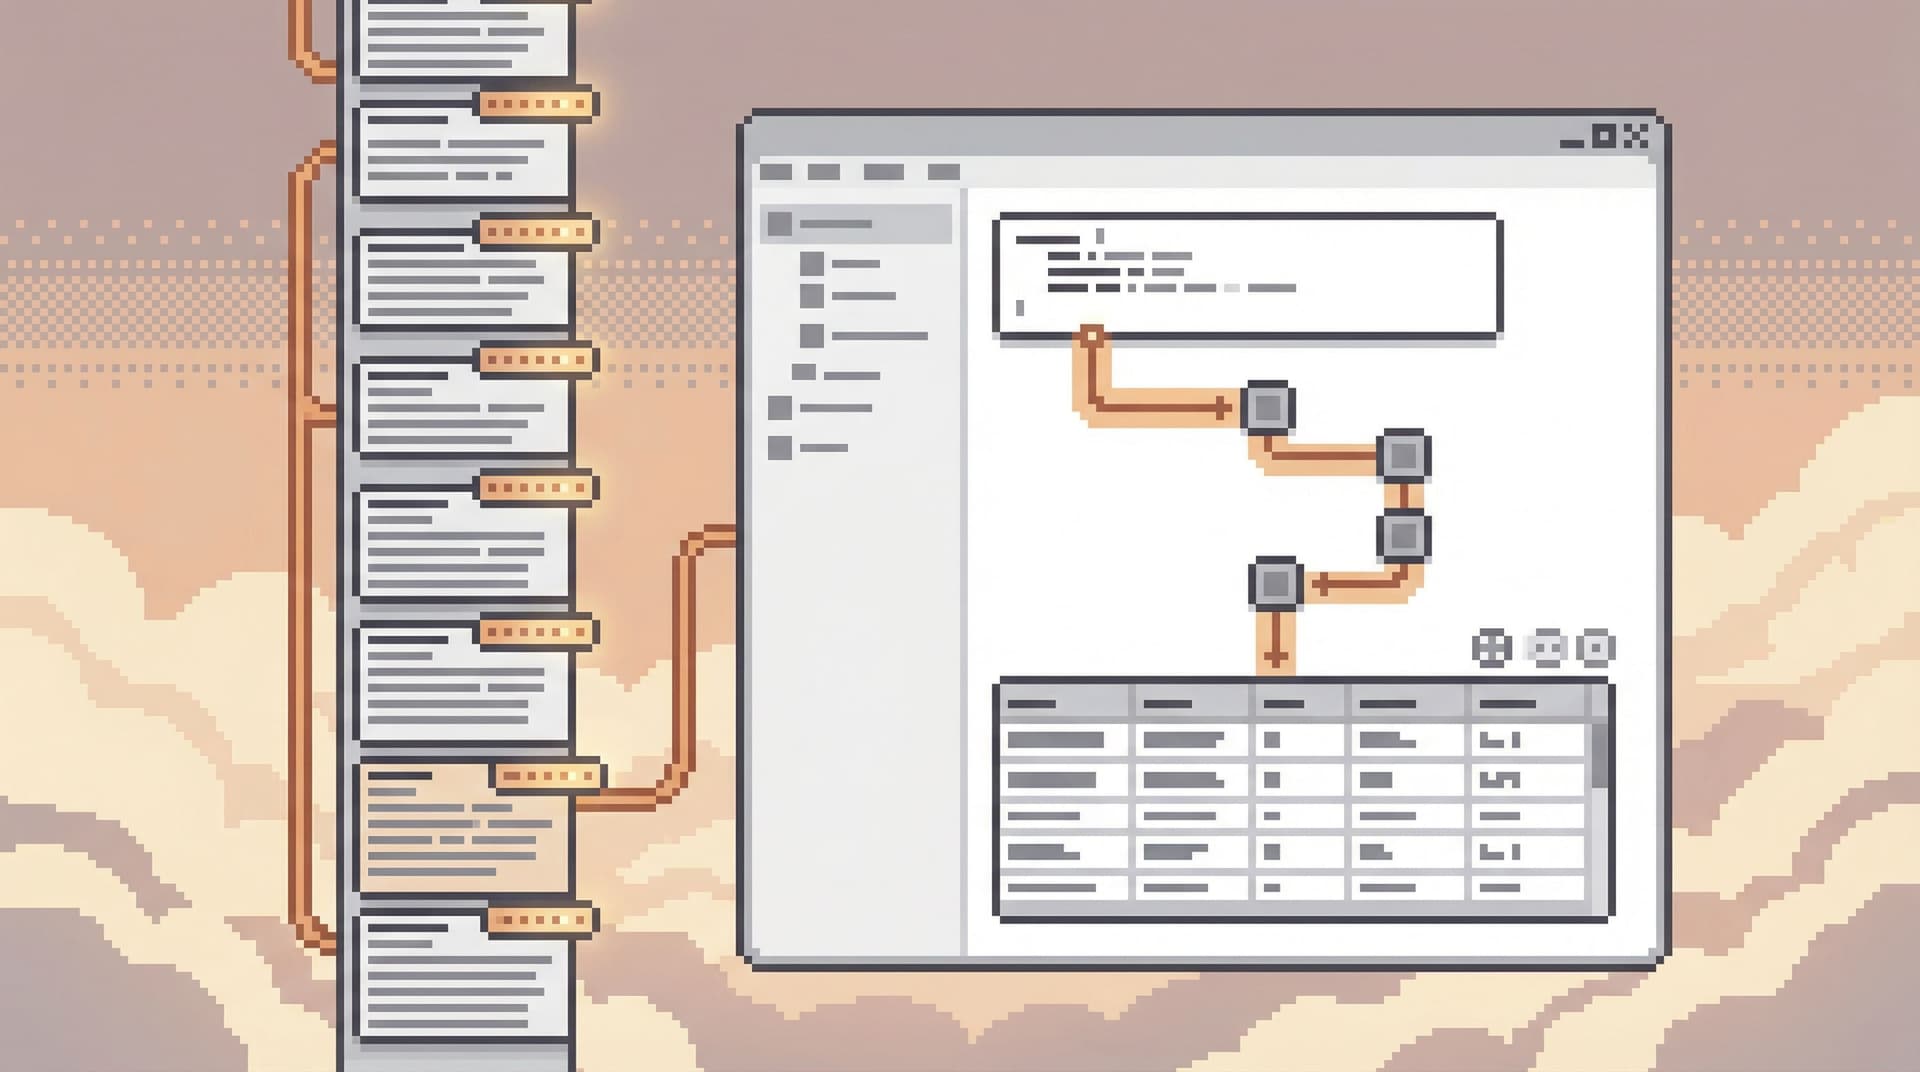
Step 3: Enter the database through a narrow door
Now you’re ready to read production.
The important part: don’t start from a blank editor or a schema tree. Start from the incident key.
In Simpl, that might look like:
- Open the relevant entity view (e.g.,
Orders,Subscriptions,Job Runs). - Apply filters using your incident key:
order_id = 991288- Time window around the incident
- Pin that filtered view as your anchor tab for the session.
This anchor tab is your “home base.” Every other query or view should connect back to it.
A calm pattern here:
- One anchor tab: the primary entity in a filtered, focused view.
- One or two supporting tabs: related entities (payments, invoices, job runs) directly linked from the anchor.
- No free‑floating exploratory tabs until the incident is understood.
If you’ve designed opinionated paths or “read rails” in your database browser, this is where they shine:
- A prebuilt “Order incident” path that pulls:
- The order row.
- Associated payments and refunds.
- Recent job runs that touched the order.
- Any manual interventions or overrides.
Even without formal rails, you can approximate this manually:
- Use foreign keys and known relationships to move one hop at a time.
- Favor links and joins from the anchor entity instead of ad‑hoc jumps across the schema.
For more on structuring reads this way, Designing Read Rails: How Opinionated Query Paths Reduce Risk and Cognitive Load is a deeper dive.
Step 4: Ask only the questions that matter
Once you’re looking at the right rows, it’s tempting to wander:
- “While I’m here, let me check this other table…”
- “What if we also compare last week’s data…”
That’s how incidents stretch.
Keep your session anchored on a few concrete questions:
-
Is the data consistent with what the logs say?
- If logs say “payment failed,” do you see a failed payment row, or a mismatch in status?
- If the stack trace shows a missing record, is it truly absent, or just in an unexpected state?
-
Is the failure isolated or systemic?
- Are there other orders for the same user in a similar state?
- Other job runs around the same time with similar symptoms?
-
What is the smallest, clearest explanation in rows?
- “This order was marked
paidbut has no successful charge.” - “This job retried three times, but the state machine never advanced past
processing.”
- “This order was marked
A useful discipline:
- For each question, run one focused read.
- Capture the result (link, screenshot, or note) in the incident channel or ticket.
- Don’t open a new question until you’ve either answered or explicitly parked the current one.
This is where tools like Simpl help by:
- Making it easy to name and save small, focused views (e.g., “Order 991288 – Payments Around Incident”).
- Avoiding the distraction of write operations, migrations, or admin tasks.
Step 5: Turn the read into a trail
The investigation you just did is valuable. Don’t let it evaporate.
Instead of:
- Copying raw SQL into Slack.
- Pasting CSVs into tickets.
- Relying on someone’s memory of “what we checked.”
Create a trail:
- A short sequence of saved views or queries that:
- Start from the incident key.
- Walk through the entities you inspected.
- End at the rows that explain the failure.
In Simpl, this can look like:
- A named trail:
INC-482 – Checkout double-charge (user 48291, order 991288). - Steps:
Ordersfiltered toorder_id = 991288.Paymentsfiltered to that order, windowed around the incident.Job Runsfor the reconciliation job touching that order.
Benefits:
- Reproducibility: anyone can replay the investigation later.
- Reviewability: post-incident reviews can look at the exact reads, not just summaries.
- Reusability: a similar incident tomorrow can start from this trail and adapt.
This is the core idea behind opinionated history and query trails: turning ephemeral reads into a calm knowledge base instead of exhaust.
Step 6: Share context quietly
Incidents usually involve more than one person:
- Someone from support bringing in customer context.
- A data engineer checking for broader impact.
- Another backend engineer validating a fix.
Instead of live screen shares and “can you scroll up,” share links to the trail and views:
-
Paste a link to the anchor view into Slack:
“This is the order as it looked during the incident.” -
Paste a link to the full trail into the incident ticket:
“Replay these three steps to see how we confirmed the double-charge.” -
Add a short note:
“Step 2 shows two successful charges for the same order within 2 seconds; that’s the core bug.”
This “quiet handoff” pattern:
- Reduces the need for long Zoom sessions.
- Makes it easy for someone to pick up where you left off.
- Keeps production reads grounded in concrete, shareable artifacts.
If you want to go deeper on this pattern, The Quiet Handoff: Sharing Production Database Context Without Screenshares or Zoom explores it in detail.
Step 7: Close the loop with code and logging
Once you’ve identified the root-cause rows, you’re not done.
A calm workflow ends by tightening the feedback loop between:
- Code (where the bug lives).
- Logs (where it first surfaced).
- Rows (where you confirmed it).
Make small, concrete improvements:
-
In code:
- Add explicit guards or invariants around the failing path.
- Ensure critical state transitions (e.g.,
pending→paid) are logged with stable identifiers.
-
In logging / tracing:
- Include the incident key fields (user, order, job run IDs) in structured logs.
- Add links from your error tracker to pre-filtered views in Simpl using those keys.
-
In your database browser:
- Save the trail you used as a template for future incidents.
- Promote especially useful trails into team-wide, named workflows (e.g., “Checkout Failure Investigation”).
Over time, this turns your incident workflow into a library of narrow, proven paths from stack traces to rows.
Putting it all together: a calm incident story
Imagine a billing incident:
- Error tracker shows repeated
ChargeAlreadyCapturedErroronPOST /checkout. - Logs reveal
user_id=48291,order_id=991288, and a specific request ID. - You declare the incident key:
user_id=48291,order_id=991288, window2026-04-10 12:55–13:10 UTC. - In Simpl, you:
- Open
Orders, filter toorder_id=991288, pin as anchor. - From there, open related
Paymentsfiltered to that order and time window. - Notice two successful charges with the same external payment ID.
- Open
- You save a trail with these steps and share it in the incident channel.
- Another engineer uses the trail to confirm the bug in the idempotency logic.
- After the fix, you keep the trail as
Checkout double-charge investigationfor future reference.
No wandering across consoles. No guessing which query someone ran. Just a straight, calm line from stack traces to rows.
Summary
A calm workflow for debugging incidents looks like this:
- Stabilize context from stack traces and logs into a small set of anchors.
- Define an incident key that identifies one failing path.
- Enter the database through that key, not through a blank editor.
- Anchor your session on one primary view, with 1–2 related views at most.
- Ask only the questions that matter, and answer each with a focused read.
- Turn reads into a trail that others can replay.
- Share context quietly with links, not screenshots and screen shares.
- Close the loop by improving code, logging, and your database workflows.
Tools like Simpl make this easier by giving you a calm, opinionated interface for production reads instead of a wide-open admin console. But the core ideas—narrow paths, stable keys, replayable trails—are tool-agnostic.
Take the first step
You don’t need to redesign your entire incident process to get value from this.
Pick one small change:
- Start using explicit incident keys in your incident channels.
- Configure a single, focused incident view in Simpl for your most common failure path (e.g., checkout, sign-up, billing job).
- Turn your next real incident into a named trail instead of a handful of ad‑hoc queries.
The next time a stack trace pings you, you’ll have something better than a blank editor: a calm, straight path from that trace to the rows that actually explain what happened.