Low-Noise Logging: Pairing Query Trails with Application Logs Without the Firehose

Most teams already have more telemetry than they can comfortably read.
You have:
- Application logs from every service.
- Query logs from every database and warehouse.
- Metrics, traces, dashboards, alerts.
And yet, when something real happens — a customer can’t check out, a background job silently fails — you still end up asking the same question:
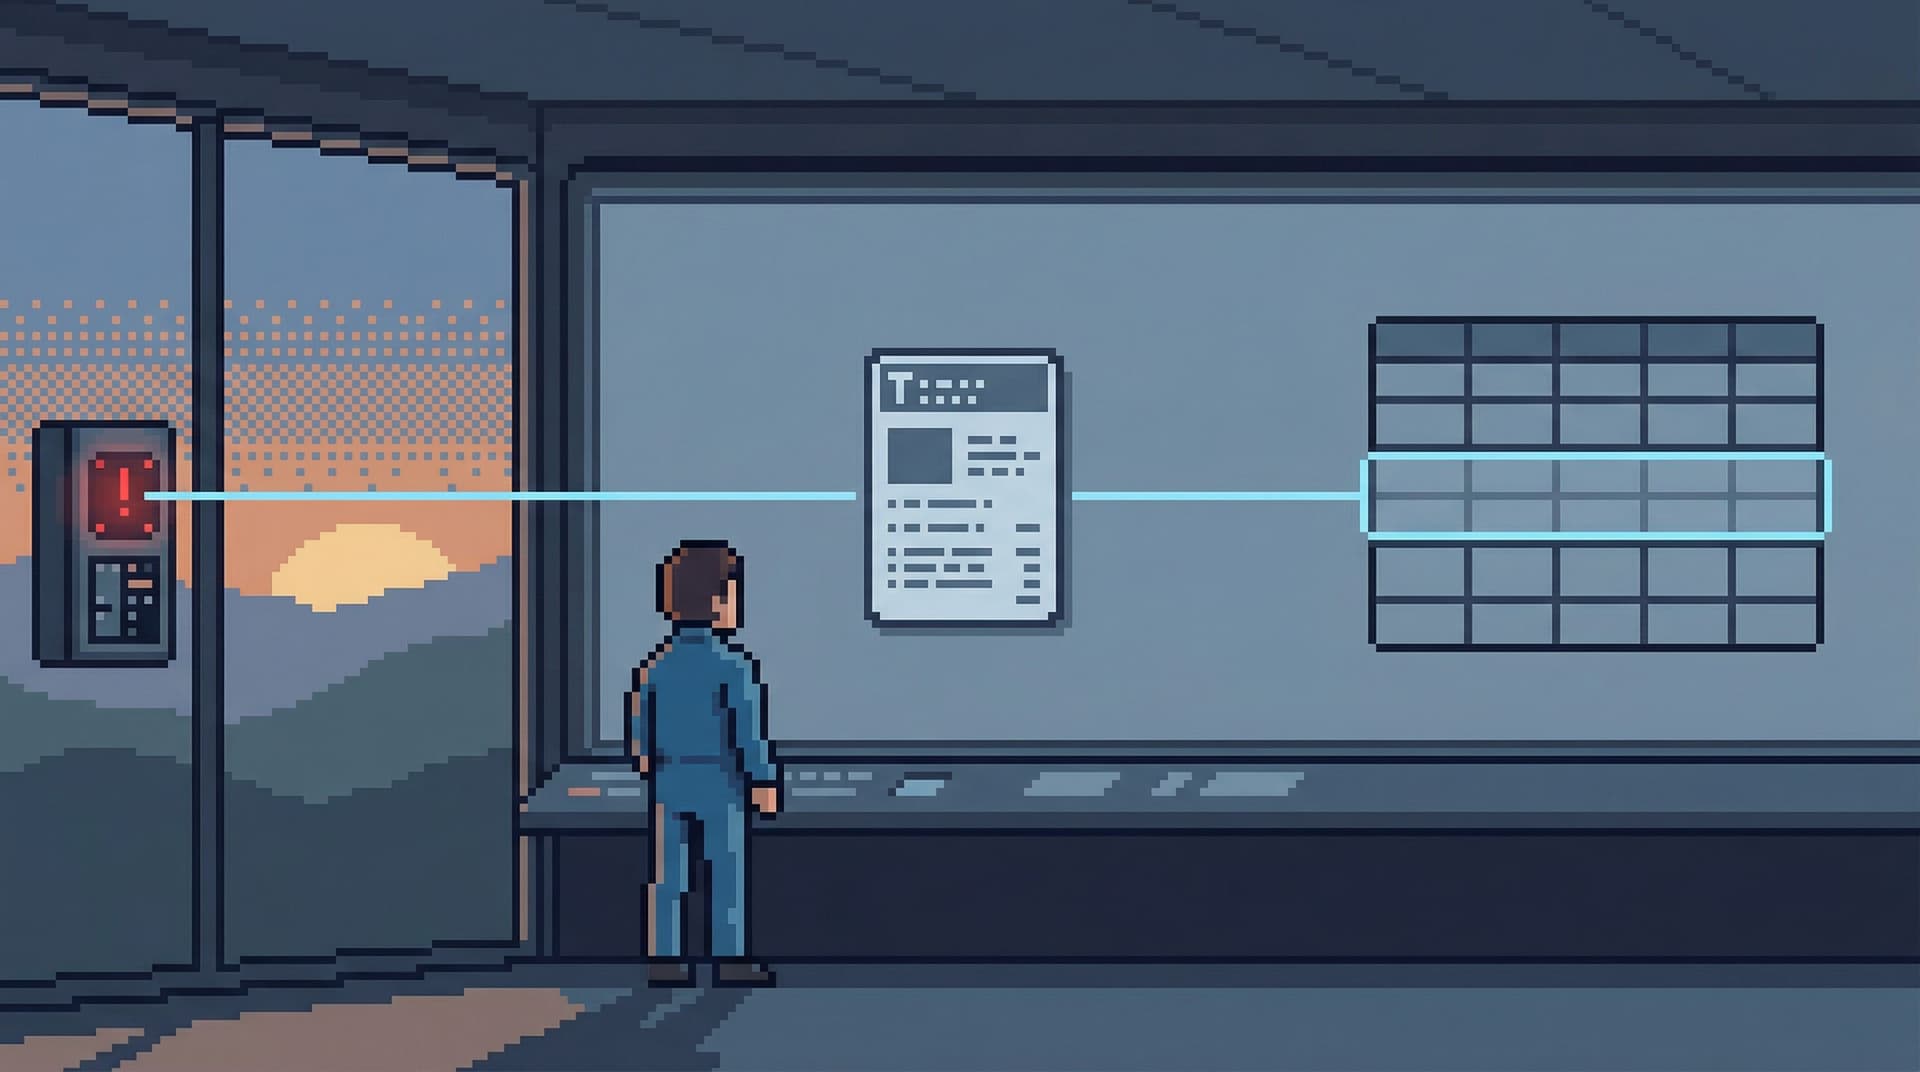
“What was this request actually doing in the database?”
This is where most setups fall down. Logs live in one world. Queries live in another. During incidents, people try to mentally stitch them together, usually by:
- Grepping logs for a user ID.
- Manually re-running queries in a console.
- Copying SQL snippets into Slack.
It works, but it’s noisy. And it does not scale.
Low-noise logging is a different stance: instead of collecting more data, you deliberately pair a small, well-structured query trail with your existing application logs. The goal isn’t a perfect trace of everything. It’s a calm, repeatable way to see “this request → these queries → these rows” without turning on a firehose.
Tools like Simpl exist in this gap: an opinionated database browser that keeps query history focused, explorable, and safe enough to pair directly with application context.
Why pairing logs and queries matters
If you already have logs, metrics, and traces, why bother?
Because most debugging and investigation work quietly reduces to three moves:
-
From symptom to request
You start with an alert, a support ticket, or a user complaint. -
From request to queries
You need to see which queries ran, in what order, and how they behaved. -
From queries to rows
You need to see concrete data: which customer, which order, which job.
Metrics and traces are good at step 1. Raw query logs are good at step 3, if you already know what to look for. Step 2 — the bridge — is usually missing or fragile.
When that bridge is weak, you see familiar symptoms:
- Incident calls where someone shares a terminal and narrates what they’re typing.
- Support escalations that stall on “we need an engineer to dig in.”
- Repeated queries that live in screenshots instead of a shared, searchable history.
We’ve written before about designing a straight line from alerts to rows in From Tables to Tickets: A Straight-Line Workflow From Alert to Root-Cause Row. Low-noise logging is one of the underlying mechanics that makes that straight line possible.
Done well, pairing query trails with application logs gives you:
- Faster incident triage – You can jump from an error log to the exact queries and rows that mattered, without hunting.
- Clearer ownership – You can see which service, handler, or feature produced which database behavior.
- Safer exploration – You don’t need to re-run risky queries just to understand what happened.
- Less cognitive load – People follow links and trails, not hunches and half-remembered SQL.
The key is to do this without turning your observability stack into a wall of noisy, per-query logs no one can reason about.
The problem with the firehose
When teams try to connect logs and queries, they usually default to one of two extremes:
-
Log everything, everywhere
Every query is logged at INFO or DEBUG with full SQL, parameters, and timing. -
Log nothing, rely on the database
Application logs stay clean. Query insight comes from database-native logs or slow query tables.
Both have real costs.
Logging every query
Logging every query at the application layer sounds simple and safe: you’ll always know what happened.
In practice, it often leads to:
- Volume spikes – Logging every ORM call can multiply your log volume by 5–10x.
- Sensitive data risk – Query parameters can include emails, tokens, or PII that shouldn’t live in general-purpose logs.
- Signal loss – When everything is logged, nothing stands out. The queries you actually care about are buried.
- Performance overhead – Serializing and shipping large log lines for every query adds latency and cost.
Relying on database logs alone
On the other side, relying purely on database logs keeps application logs clean but creates its own friction:
- Context gap – DB logs know nothing about the feature, endpoint, or user story behind a query.
- Difficult correlation – You’re matching timestamps and connection IDs across tools by hand.
- Operational friction – Accessing and searching database logs is often restricted to a small group.
Low-noise logging takes a narrower stance: you don’t need every query in your app logs. You need stable, linkable trails for the kinds of work that matter most.
Design principles for low-noise logging
Before touching code, it helps to be explicit about what you’re optimizing for.
A low-noise logging setup should:
-
Center on a request or workflow ID
Every relevant log line and query should be traceable back to a single, stable identifier. -
Capture the shape, not the full text, of most queries
Full SQL is sometimes necessary, but often a normalized fingerprint is enough. -
Elevate only the important queries
Not every cache check or feature flag lookup deserves first-class logging. -
Lean on a calm query browser instead of stuffing everything into logs
Use logs as pointers into a richer, safer query history — not as the history itself.
This is the same philosophy behind Opinionated History: Turning Your Query Log into a Calm Knowledge Base: treat query trails as structured, reusable knowledge, not raw exhaust.
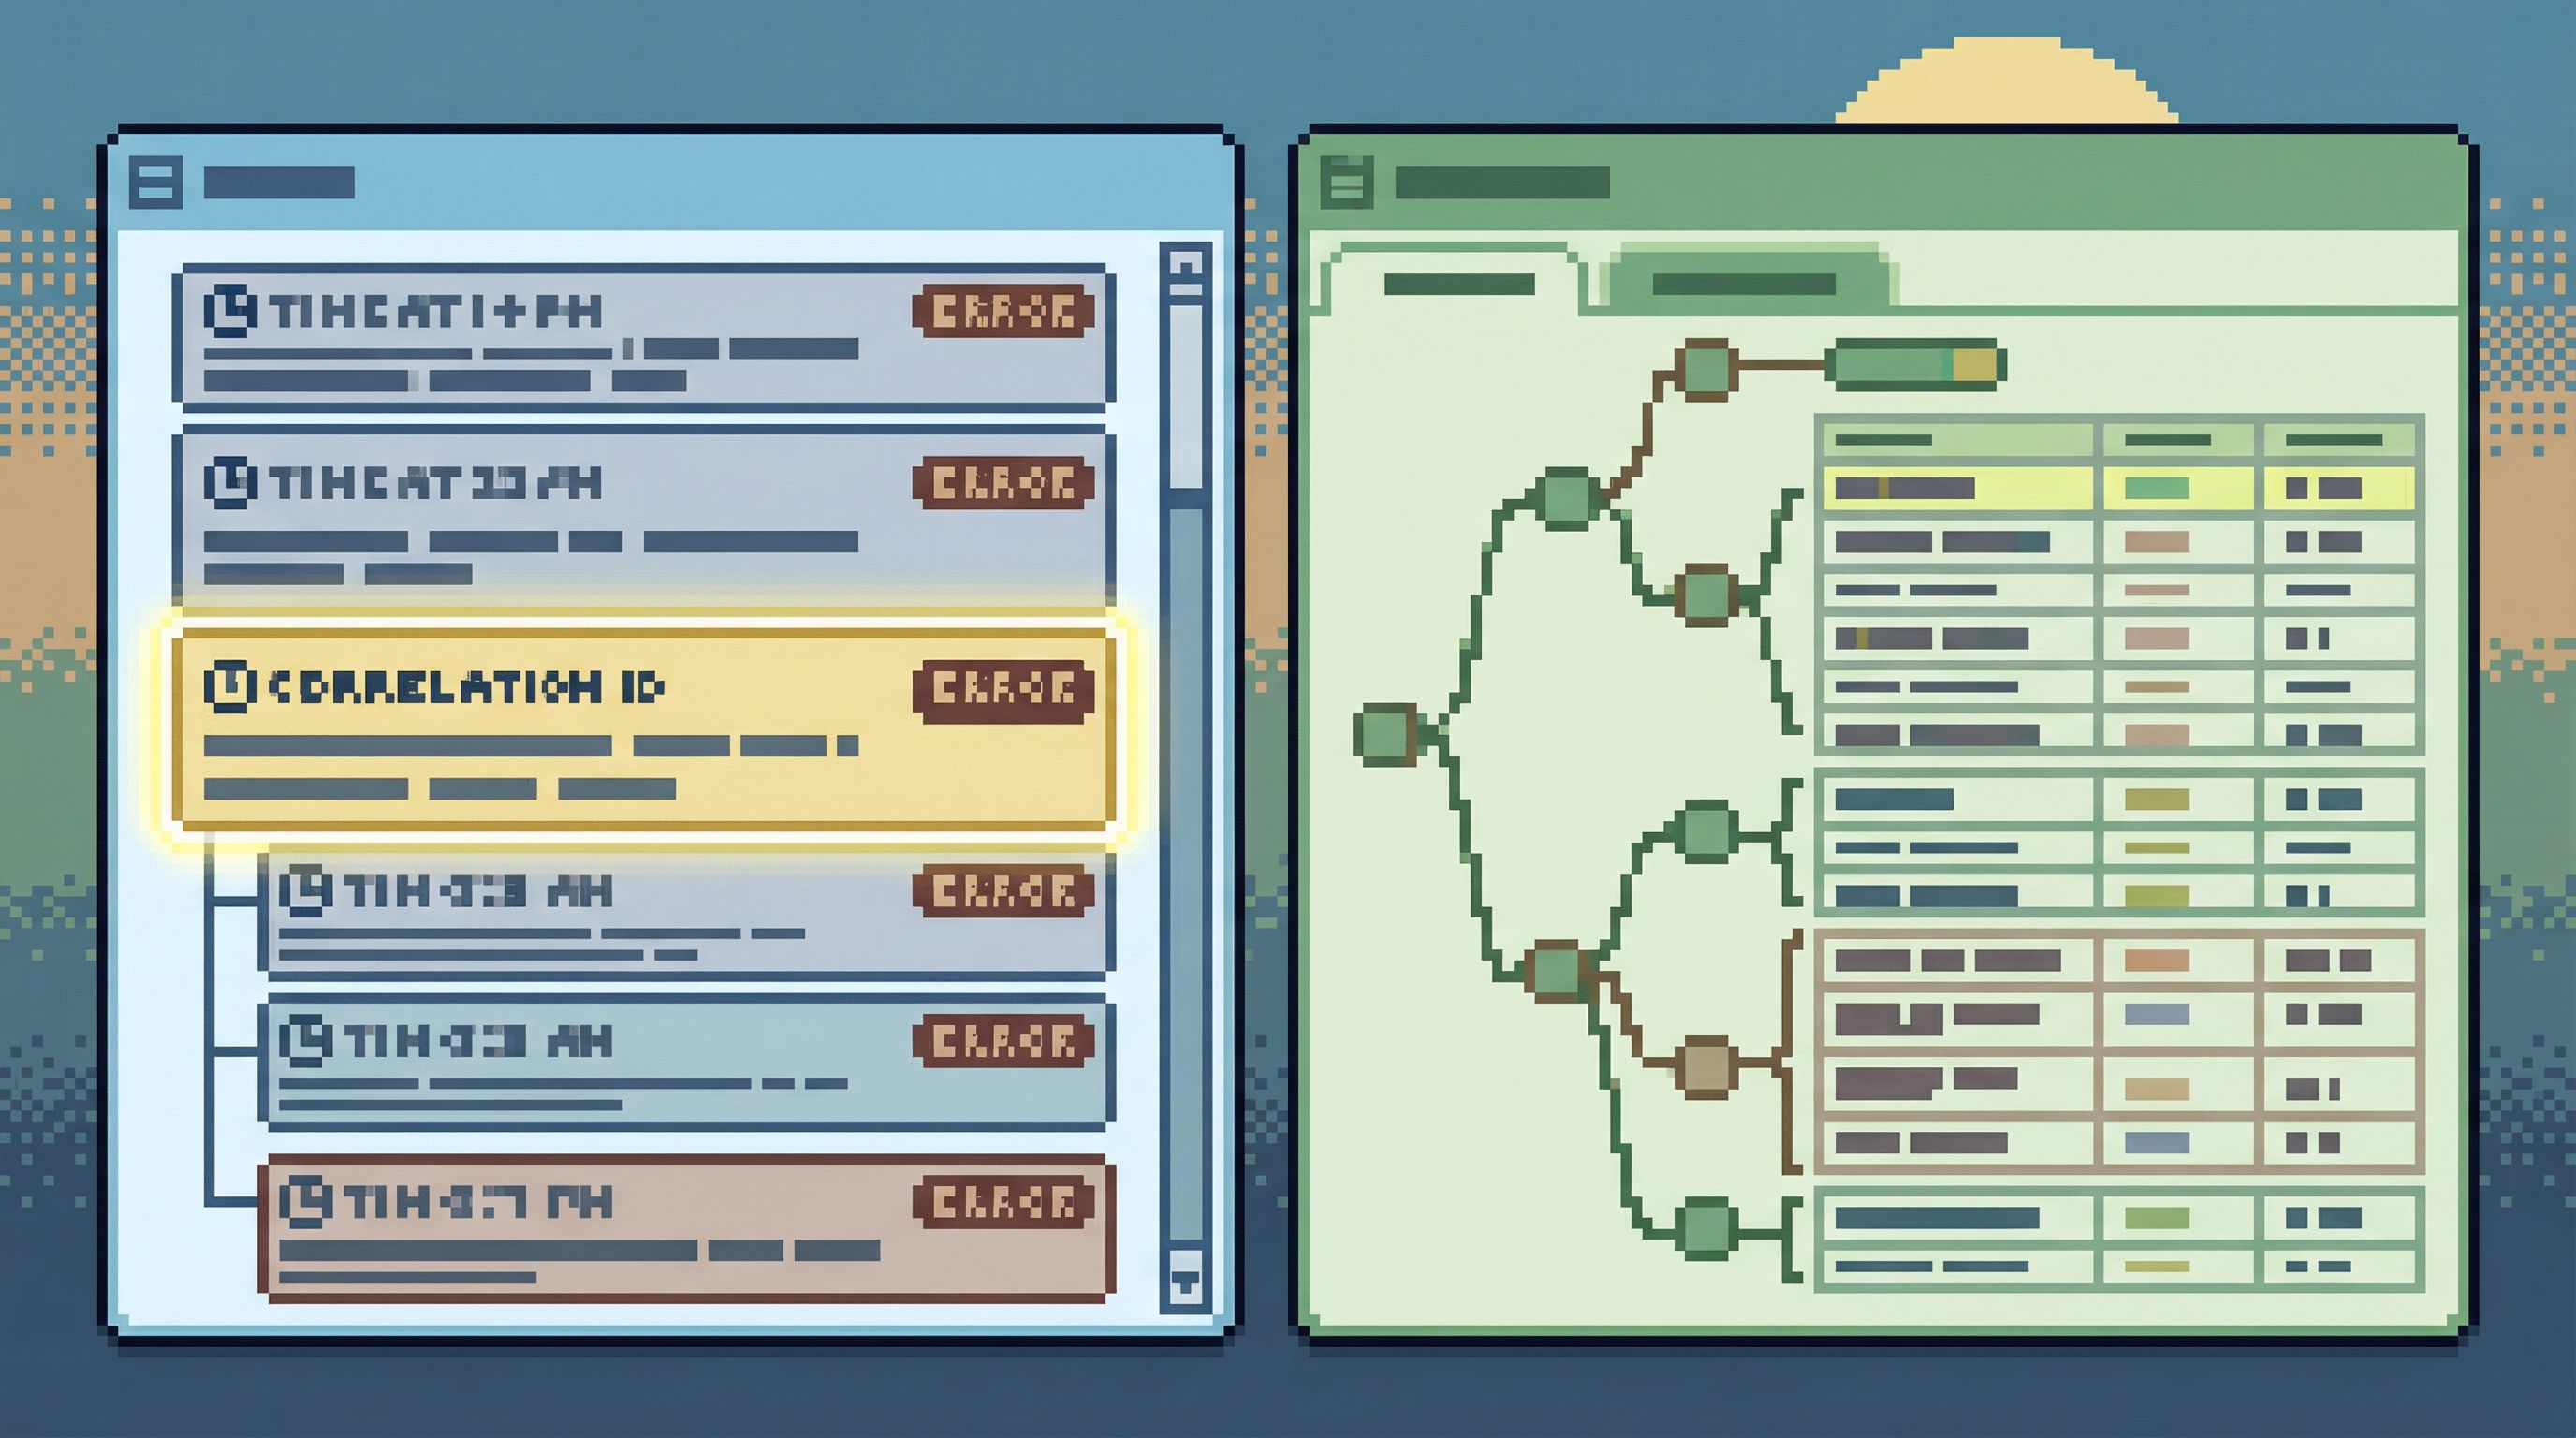
Step 1: Establish a stable correlation ID
Everything starts with a stable correlation ID that flows through your system.
This might be:
- A request ID generated at your edge or API gateway.
- A job run ID for background workers.
- A domain-specific ID for long-lived workflows (e.g.,
checkout_session_id).
Requirements for this ID:
- It’s generated once per meaningful unit of work.
- It’s attached to every log line related to that work.
- It’s attached to every query that work triggers (directly or via metadata).
Implementation patterns:
- In HTTP services, generate a request ID at the ingress layer and inject it into the request context.
- In background jobs, derive a job ID at enqueue time and propagate it through the job’s context.
- In both cases, use language-specific context propagation (e.g.,
AsyncLocalin .NET, context vars in Python, context propagation in Go/Java) so that your logging and database layers can pull the ID without manual plumbing on every call.
Once you have a stable ID, you can:
- Search logs by that ID and see a coherent narrative of what happened.
- Attach that ID to query trails in a tool like Simpl, so a single click jumps you from logs to rows.
Step 2: Decide which queries deserve a trail
Not every query needs to be part of a trail. Most should stay invisible.
A simple rule of thumb:
If a query can meaningfully change a user’s experience or your system’s state, it deserves a trail.
This usually includes:
- Writes and upserts that change core domain entities (orders, subscriptions, payments).
- Reads that drive critical decisions (authorization checks, billing calculations).
- Expensive reads that are likely to show up in incident reviews (multi-join reports, cross-shard lookups).
It usually does not include:
- Simple lookups on small tables (feature flags, configs) unless they’re security-critical.
- Health checks and connection warm-ups.
- ORM chatter that’s already well-covered by metrics.
You can encode this selectivity by:
- Tagging ORM operations or repository methods with a
log_query_trail = trueflag. - Introducing a small wrapper around your query execution layer that decides whether to emit trail metadata.
- Using database comments to mark important queries (e.g.,
/* trail:checkout */) and filtering on those in your query browser.
In Simpl, opinionated history is built on this idea: not every query is equal. Some belong in a calm, navigable history; others are just noise.
Step 3: Log metadata, not raw SQL, by default
Once you’ve chosen which queries deserve a trail, you need to decide what to log.
A low-noise pattern is:
-
Always log:
- Correlation ID
- Query fingerprint (e.g., normalized SQL without literals)
- High-level label (e.g.,
"load_checkout_summary") - Duration and row count
- Outcome (success, failure, timeout)
-
Sometimes log:
- Full SQL text (only when needed for debugging or performance work)
- Key parameter values (carefully redacted)
-
Never log:
- Raw secrets, tokens, or unredacted PII.
This gives you a compact log line, for example:
level=INFO
correlation_id=req_123
query_label=load_checkout_summary
fingerprint="SELECT ... WHERE user_id = ? AND created_at > ?"
rows=42
duration_ms=23
source_service=checkout-api
From this single line, you can:
- See that a meaningful query ran for a specific request.
- Filter and aggregate by label or fingerprint.
- Jump into your query browser to see the full, structured result set when needed.
You don’t need to make logs carry the whole burden of query understanding. That’s what a calm, opinionated browser is for.
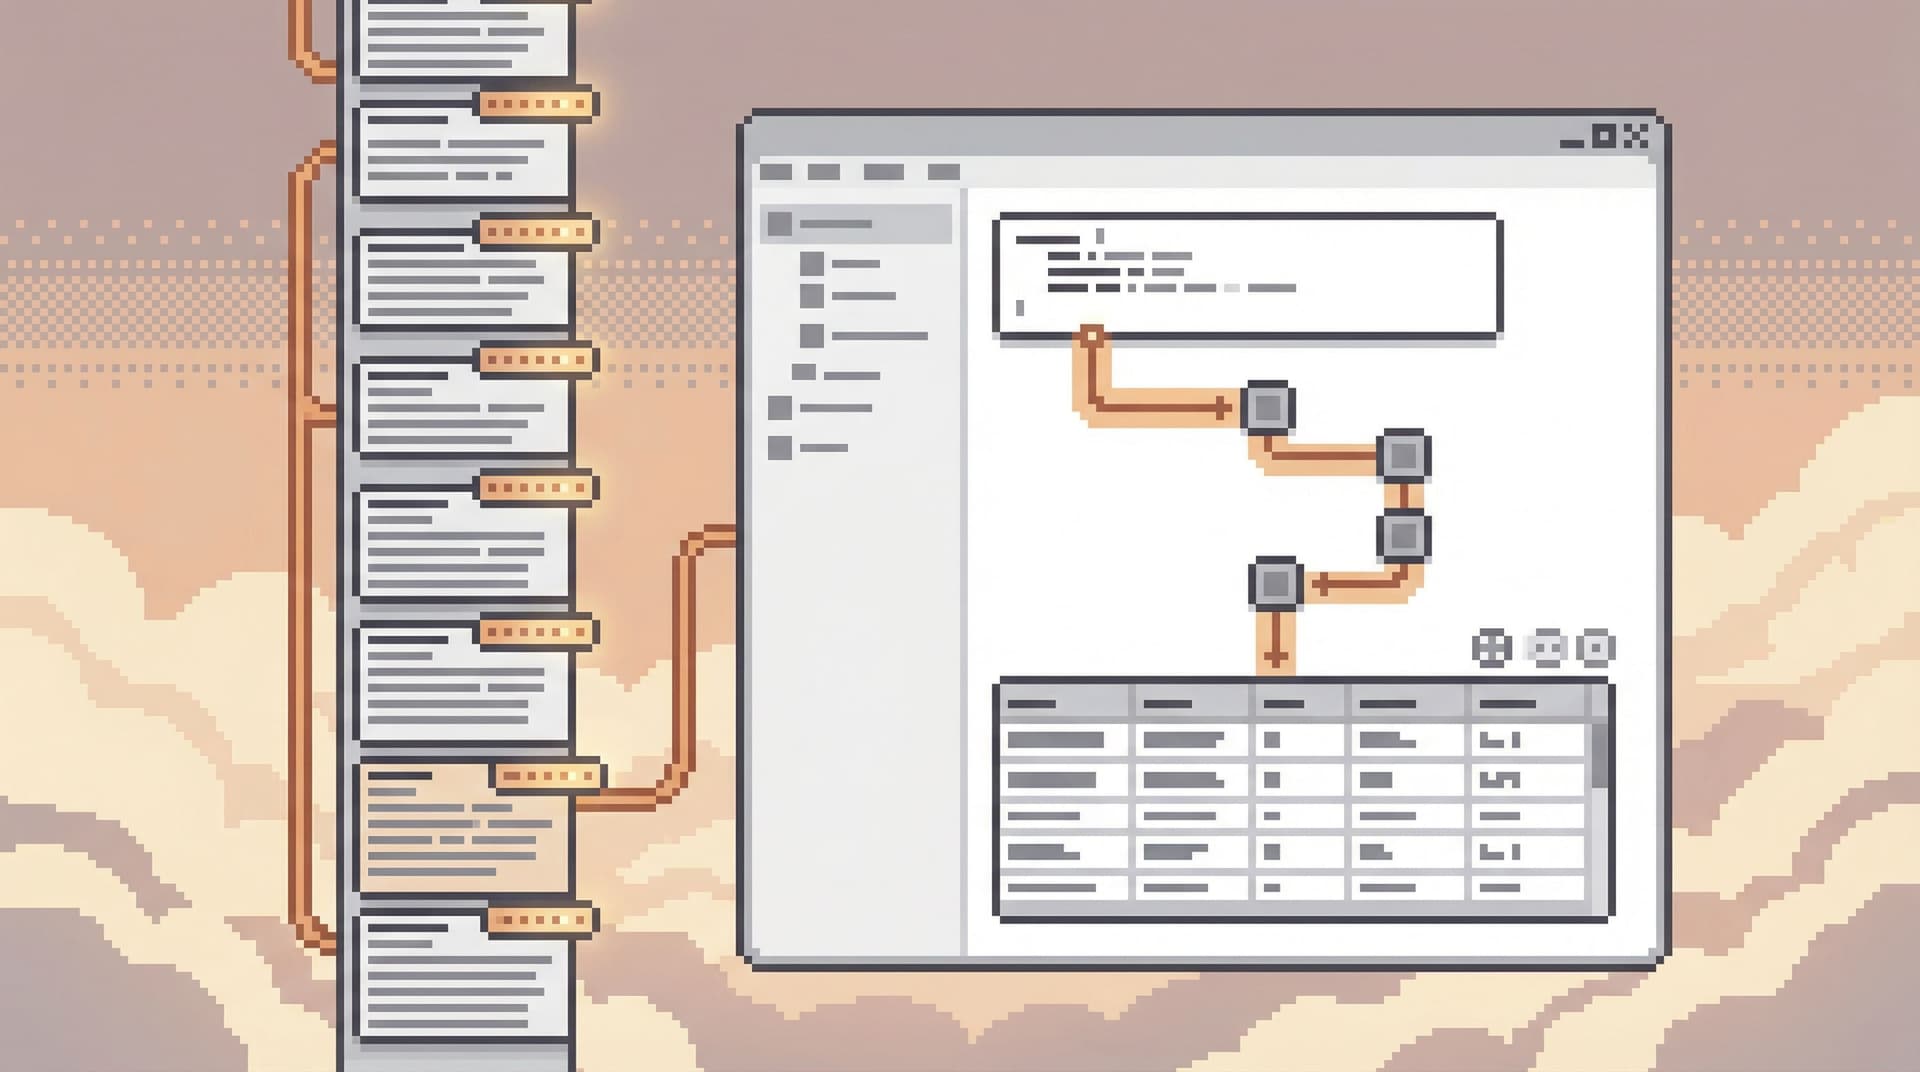
Step 4: Use your query browser as the “detail pane”
Once logs are carrying compact metadata, you need a place where people can safely explore the details.
This is where a tool like Simpl fits:
- Logs carry pointers (correlation IDs, labels, fingerprints).
- The browser carries details (full SQL, parameters, result sets, execution order).
A calm workflow looks like this:
- An alert fires. You open your log viewer and filter by
correlation_idor error ID. - You see a small set of log lines, including the query trail metadata.
- You click a link or copy an ID into your database browser.
- The browser opens a narrow session showing:
- The queries associated with that correlation ID.
- Their order, duration, and row counts.
- The actual rows returned, with guardrails.
Instead of re-running ad-hoc SQL in a full IDE, you’re replaying a trail in a tool designed for production reads. This lines up with patterns we’ve described in:
- The Narrow Incident Browser: Structuring Production Reads Around One Failing Path
- Production Reads, Not Data Dives: Structuring Database Sessions Around One Clear Question
The important part: the query browser is not another noisy console. It’s a focused, read-heavy tool where trails are first-class objects, not just text.
Step 5: Add lightweight guardrails to keep trails safe
Pairing logs and queries is powerful. It also raises safety questions.
If you can jump from logs into detailed query trails, you need to make sure those trails are:
- Read-only by default – No accidental writes or schema changes.
- Scoped by role – Support, success, and engineering may see different slices of the same trail.
- Redacted where necessary – Sensitive fields masked or omitted entirely.
This is where opinionated tools shine. Instead of giving everyone a generic SQL client, you:
- Define read-only roles with carefully shaped access, as described in Opinionated Read-Only Roles: How Access Design Shapes Everyday Database Work.
- Use column-level policies or views to hide sensitive fields.
- Present trails as pre-shaped views rather than arbitrary query editors.
A tool like Simpl is built for this kind of safe curiosity: people can follow trails, explore related rows, and share links without fear of “clicking the wrong thing.”
Step 6: Make trails shareable, not just inspectable
The last step is social, not technical.
A low-noise logging setup pays off when people can:
- Paste a single link into Slack that captures both what the app did and what the database saw.
- Hand off an investigation without screenshares or long written explanations.
- Revisit past incidents and see the exact trails that mattered.
This is the “quiet handoff” pattern we’ve written about elsewhere: instead of live walkthroughs, you share compact, navigable artifacts.
In practice, this means:
- Every query trail has a stable URL.
- That URL encodes just enough context (correlation ID, time window, environment) to be meaningful.
- Your log viewer and query browser can deep-link into each other.
Over time, these trails become a kind of living documentation of how your system behaves under real load — not in theory, but in rows. They complement incident write-ups, runbooks, and dashboards, instead of competing with them.
Putting it all together
A low-noise logging setup for query trails looks like this, end to end:
- Generate a stable correlation ID for each meaningful unit of work.
- Propagate that ID through your services, logs, and database calls.
- Selectively log query trails for the operations that matter most.
- Log compact metadata, not full SQL, by default.
- Use a calm database browser as the detail pane for trails.
- Add guardrails so following trails is safe for more than just DB experts.
- Make trails shareable, so investigations become links, not rituals.
You don’t need to overhaul your entire observability stack to start. You can begin with one service, one workflow, and one tool that treats query history as a first-class asset instead of exhaust.
Summary
Pairing query trails with application logs is less about capturing more data and more about capturing the right shape of data:
- Logs carry small, structured hints about which queries mattered for a request.
- A calm, opinionated browser like Simpl carries the details.
- Correlation IDs tie the two together without a firehose.
When you design this link deliberately, you get:
- Faster, calmer incident response.
- Safer, more confident production reads.
- Less wandering through consoles and dashboards.
- A growing, reusable body of query trails that explain how your system actually behaves.
It’s a quiet upgrade, but a compounding one.
Take the first step
You don’t need a full tracing overhaul to get value from low-noise logging.
Pick one path:
- A checkout flow that frequently shows up in incidents.
- A background job that silently fails more often than you’d like.
- A support escalation path that always needs an engineer.
Then:
- Add a stable correlation ID for that path.
- Log a minimal query trail for the 2–3 most important database operations.
- Wire those trails into a calm database browser like Simpl, even if it’s just for your on-call engineers at first.
Once you’ve seen a full “alert → log → trail → rows” loop work for one workflow, you’ll know where to expand next — and you can do it without ever turning on the firehose.