The Anti-Tab Debug Session: Running an Entire Incident from One Browser Window

Incidents already carry enough stress.
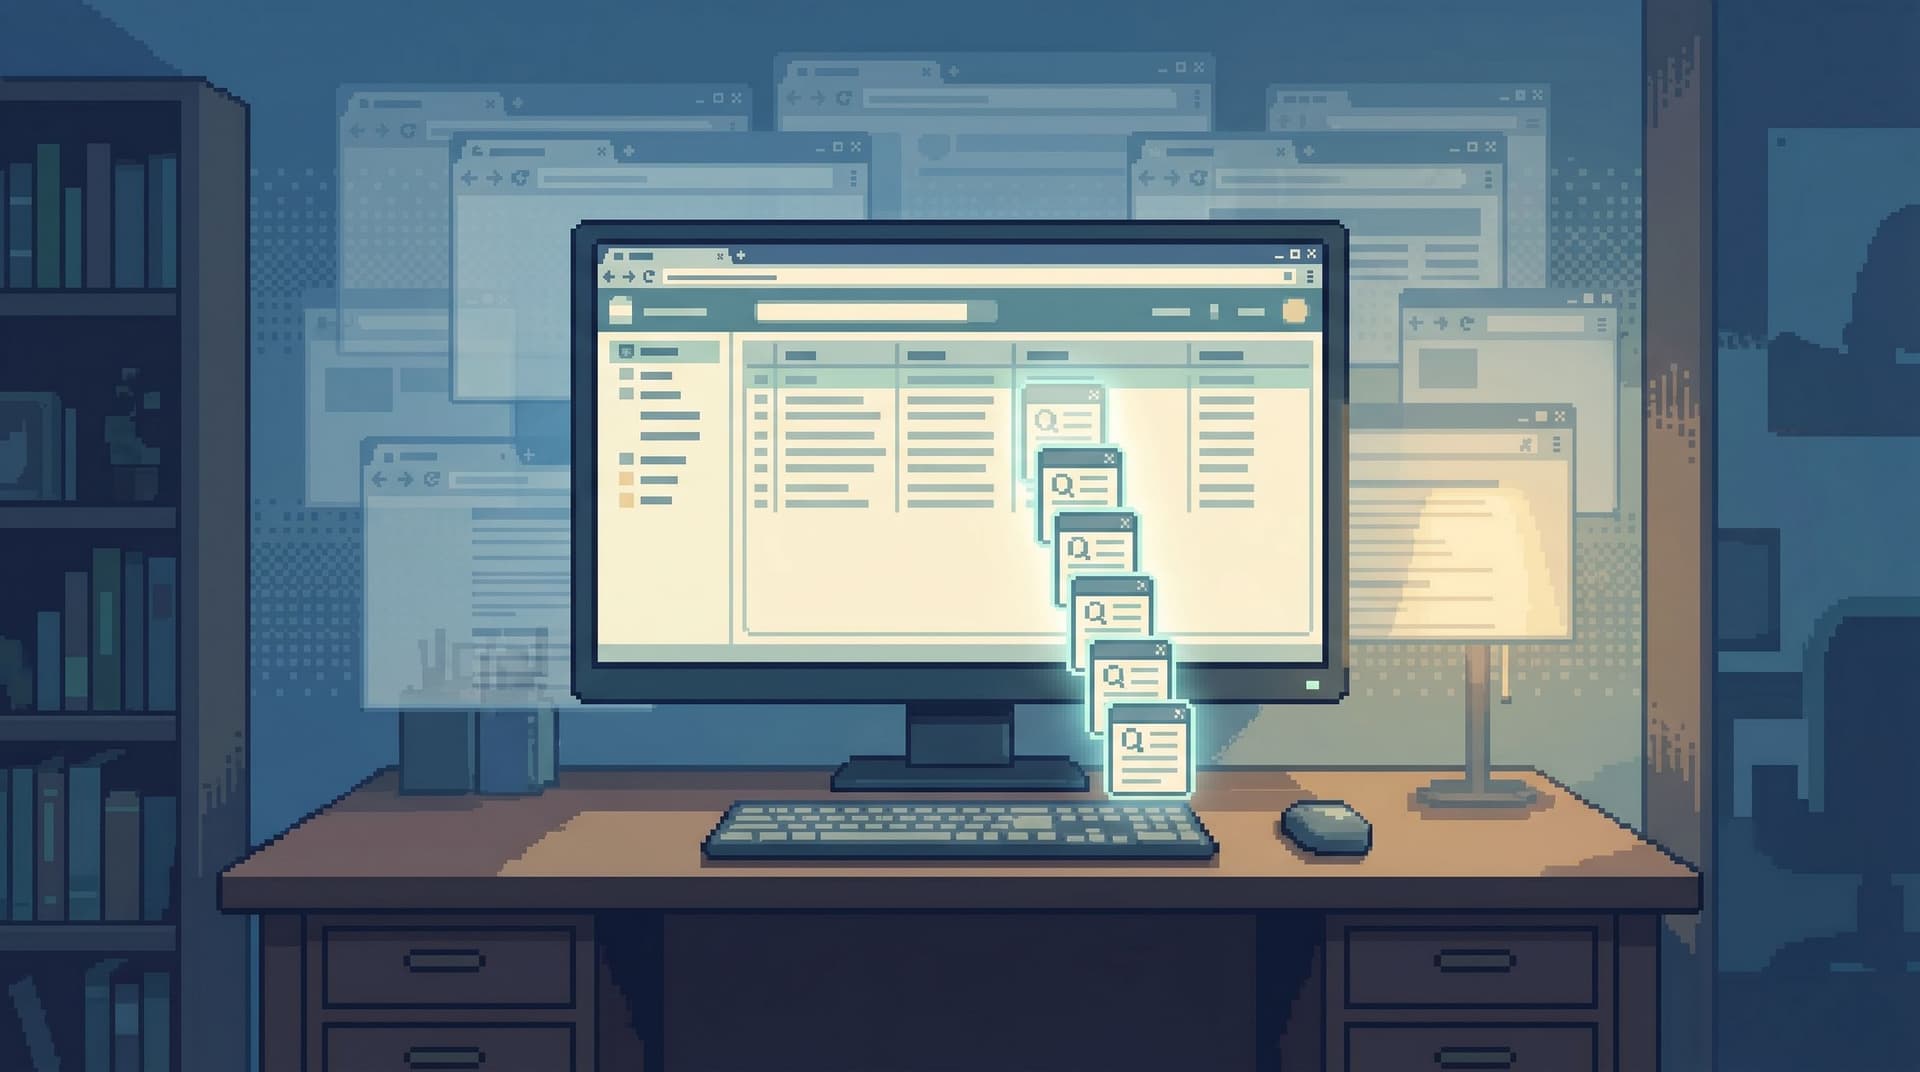
The last thing you need is a wall of tabs:
- Three dashboards
- Two log viewers
- A SQL IDE
- An admin console
- A BI tool
- A handful of internal tools “just in case”
By the time you’ve arranged them on your monitor, the incident has already grown more complex than it needs to be.
This post is about a different posture: an anti‑tab debug session.
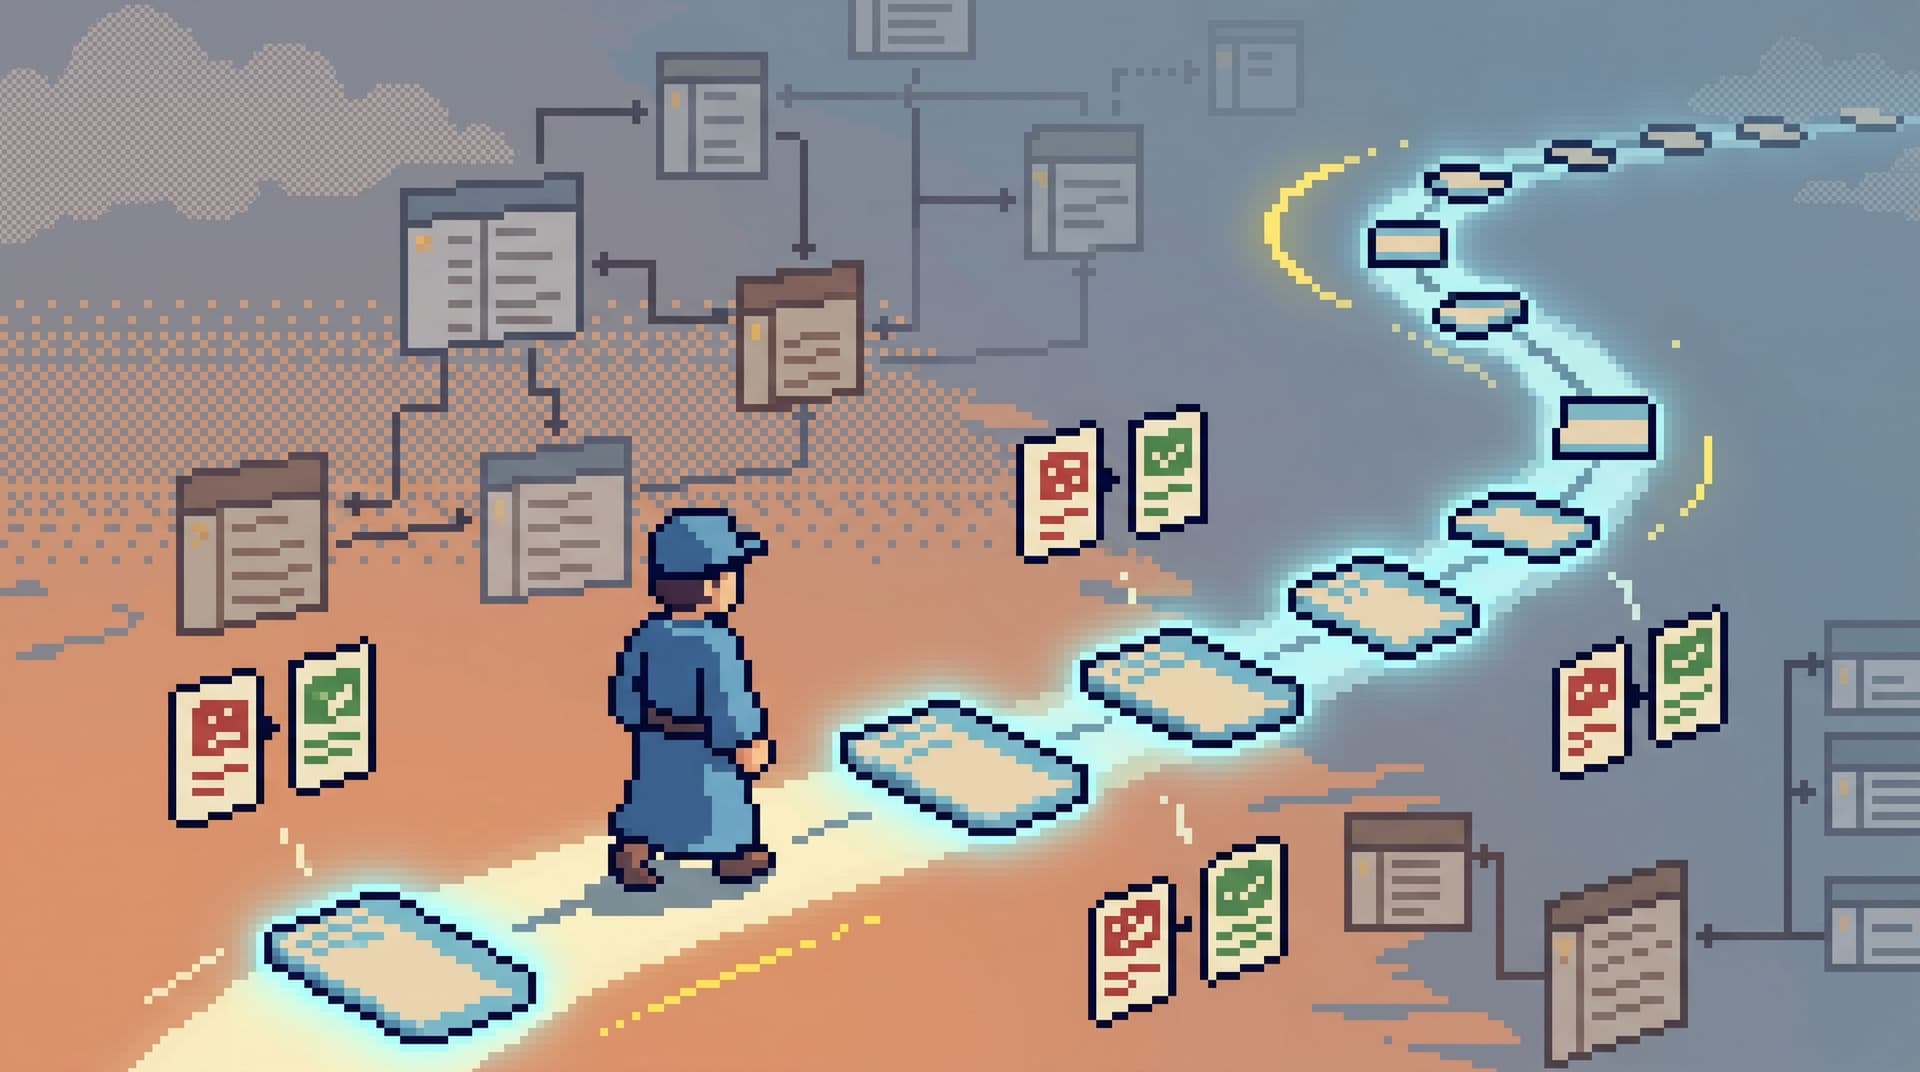
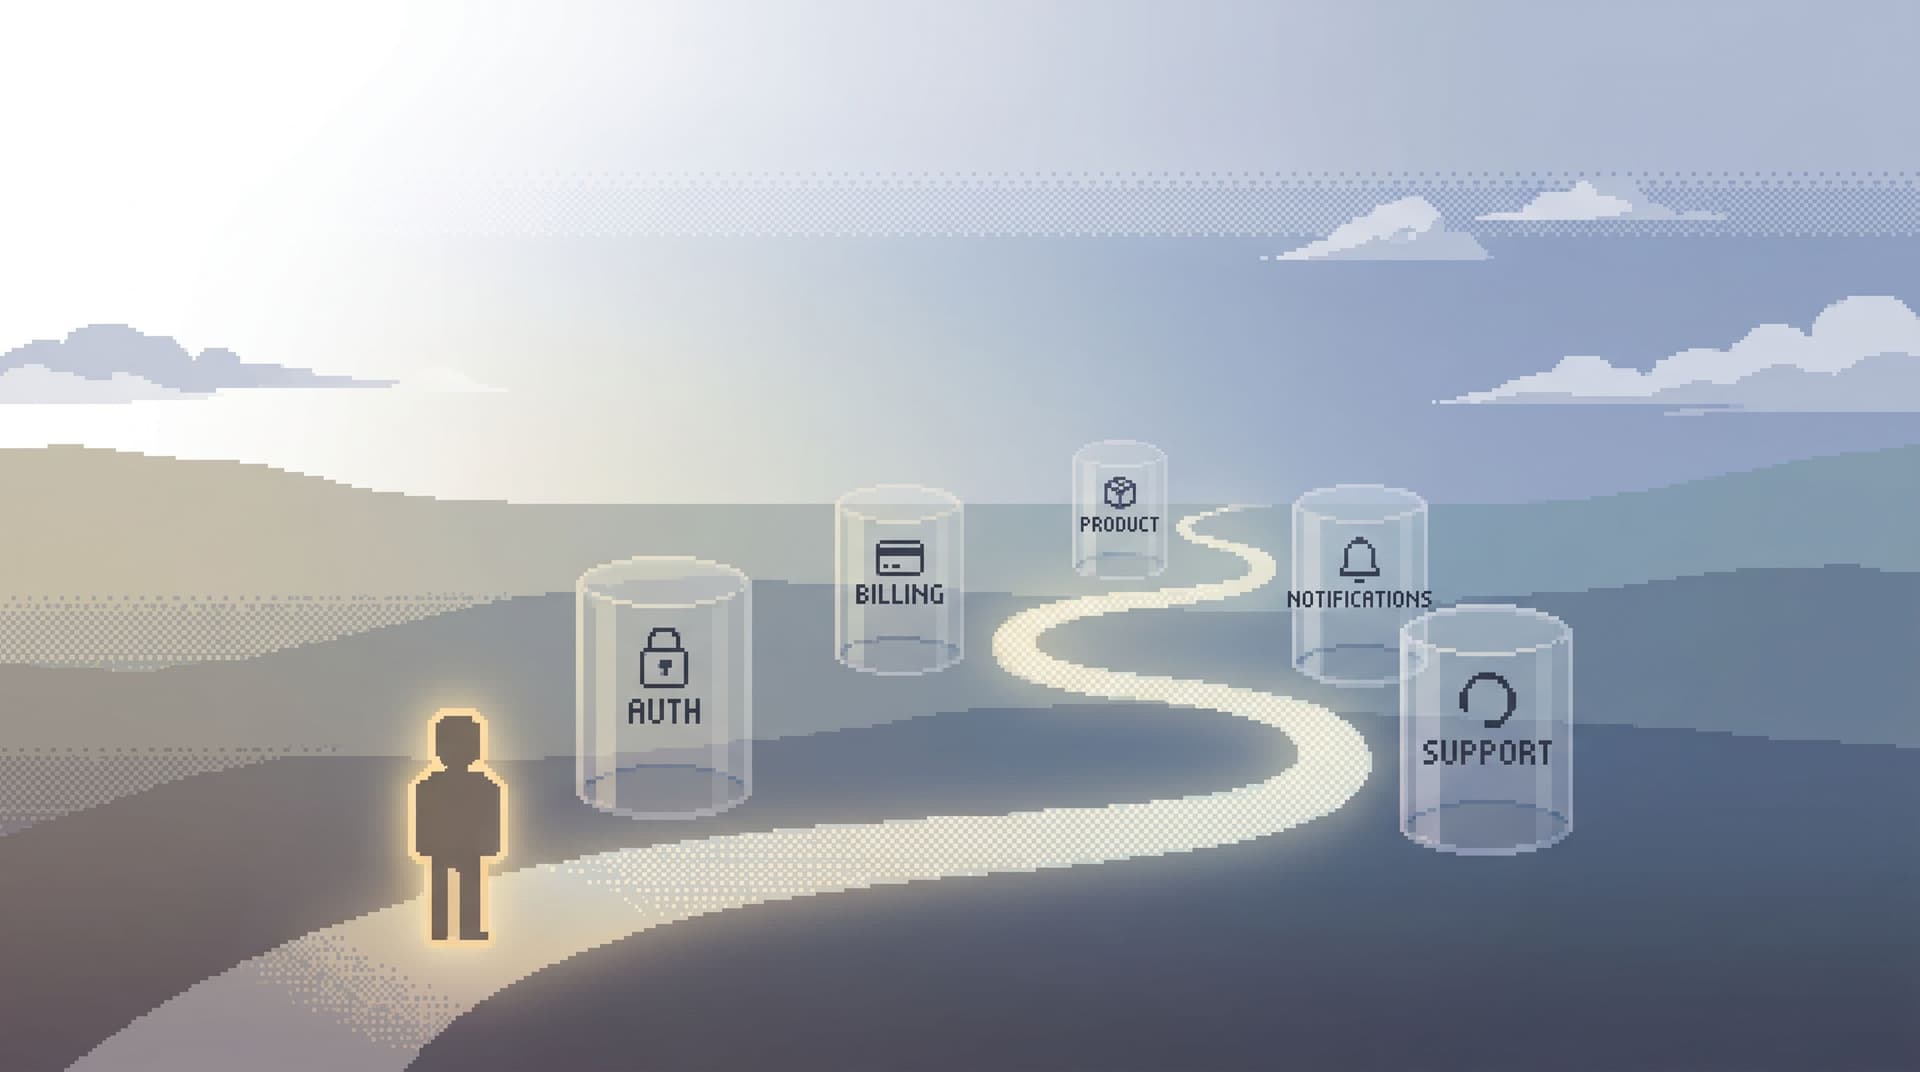
One browser window. One primary tool. A single, coherent trail from alert → data → decision.
Not because minimalism is cute, but because:
- You make faster, clearer decisions when you’re not context‑switching.
- You reduce the chance of running the wrong query in the wrong place.
- You leave behind a trail others can replay, instead of a private tower of tabs.
Tools like Simpl exist exactly for this stance: an opinionated database browser that turns production reads into a calm, linear path instead of a scattered scavenger hunt.
Why Tab Sprawl Quietly Breaks Incidents
Most teams don’t notice the cost of extra tabs. They feel cheap. But during incident work, they compound.
Common failure modes:
- Lost narrative – You forget why a tab is open, or which query answered which question.
- Tool whiplash – You bounce between metrics, logs, and rows, re‑parsing the same event with a new UI each time.
- Copy‑paste drift – Queries get tweaked in three places. Screenshots live in Slack. No one has the full story.
- Safety risk – Multiple consoles increase the odds of mis‑scoped queries or writes in the wrong environment.
We wrote about this pattern in more depth in Less Tabs, More Trails: Structuring Long Debugging Sessions as One Continuous Read Path. The short version: scattered tools turn every incident into a pile, not a path.
An anti‑tab debug session reverses that. The constraint is simple:
Run the entire incident from one browser window, with one primary data entry point.
Everything else is a supporting character.
What “One Browser Window” Really Means
This isn’t about never opening anything else. You will still:
- Look at an alert in your incident tool
- Skim a metric chart
- Check a log trace
The difference is where you live.
In an anti‑tab session:
- There is one canonical place where you read and refine production data.
- That place holds your filters, your parameters, your saved reads, and your trail.
- Other tools are used briefly, then closed, once they’ve pointed you back to the main window.
For many teams, that main window becomes an opinionated database browser like Simpl: read‑only, focused, and built around repeatable read paths rather than ad‑hoc SQL.
Designing Your Anti‑Tab Stack
You don’t need a full platform redesign. You need a small, opinionated stack:
- Alerting / Incident surface – PagerDuty, Opsgenie, or your equivalent.
- High‑level signal – A small set of dashboards or APM views to say “something is off.”
- Primary read surface – One tool where you inspect and follow the data trail (for many teams, this is Simpl).
The key is to treat the primary read surface as the gravity well. Everything else orbits it.
Properties of a good primary read surface
Your main window should be:
- Read‑first and safe – Production should feel like a reference library, not a minefield. (We unpack this more in The Calm Guardrail Catalog: Small UX Constraints That Make Production Reads Feel Safe.)
- Opinionated about navigation – It should nudge you to navigate by intent (user, order, incident) rather than by raw schema trees.
- Good at trails, not tiles – You should be able to see a sequence of reads as a story, not just a pile of saved queries.
- Fast enough to stay open all day – Latency kills focus.
If your current stack doesn’t have this, that’s your first project.
Running an Incident from One Window
Let’s walk through a concrete pattern. Imagine:
- An alert fires: payment failures spiking for a subset of customers.
1. Start from the alert, land in the main window
Instead of opening three tools:
- Acknowledge the alert.
- Open your primary read surface.
- Create or select a named incident session (even if it’s just a tag or note):
INC-4821: payment failures.
Every read you perform from now on should attach to that session.
2. Translate the alert into a first question
Avoid “open everything and see what looks weird.” Instead, write down the first specific question you want to answer:
- “What does a failing payment look like for one affected user?”
In your main window, that becomes a focused read:
- Filter payments by
status = 'failed'andcreated_at > alert_start_time. - Pick one user or order as your anchor for the rest of the session.
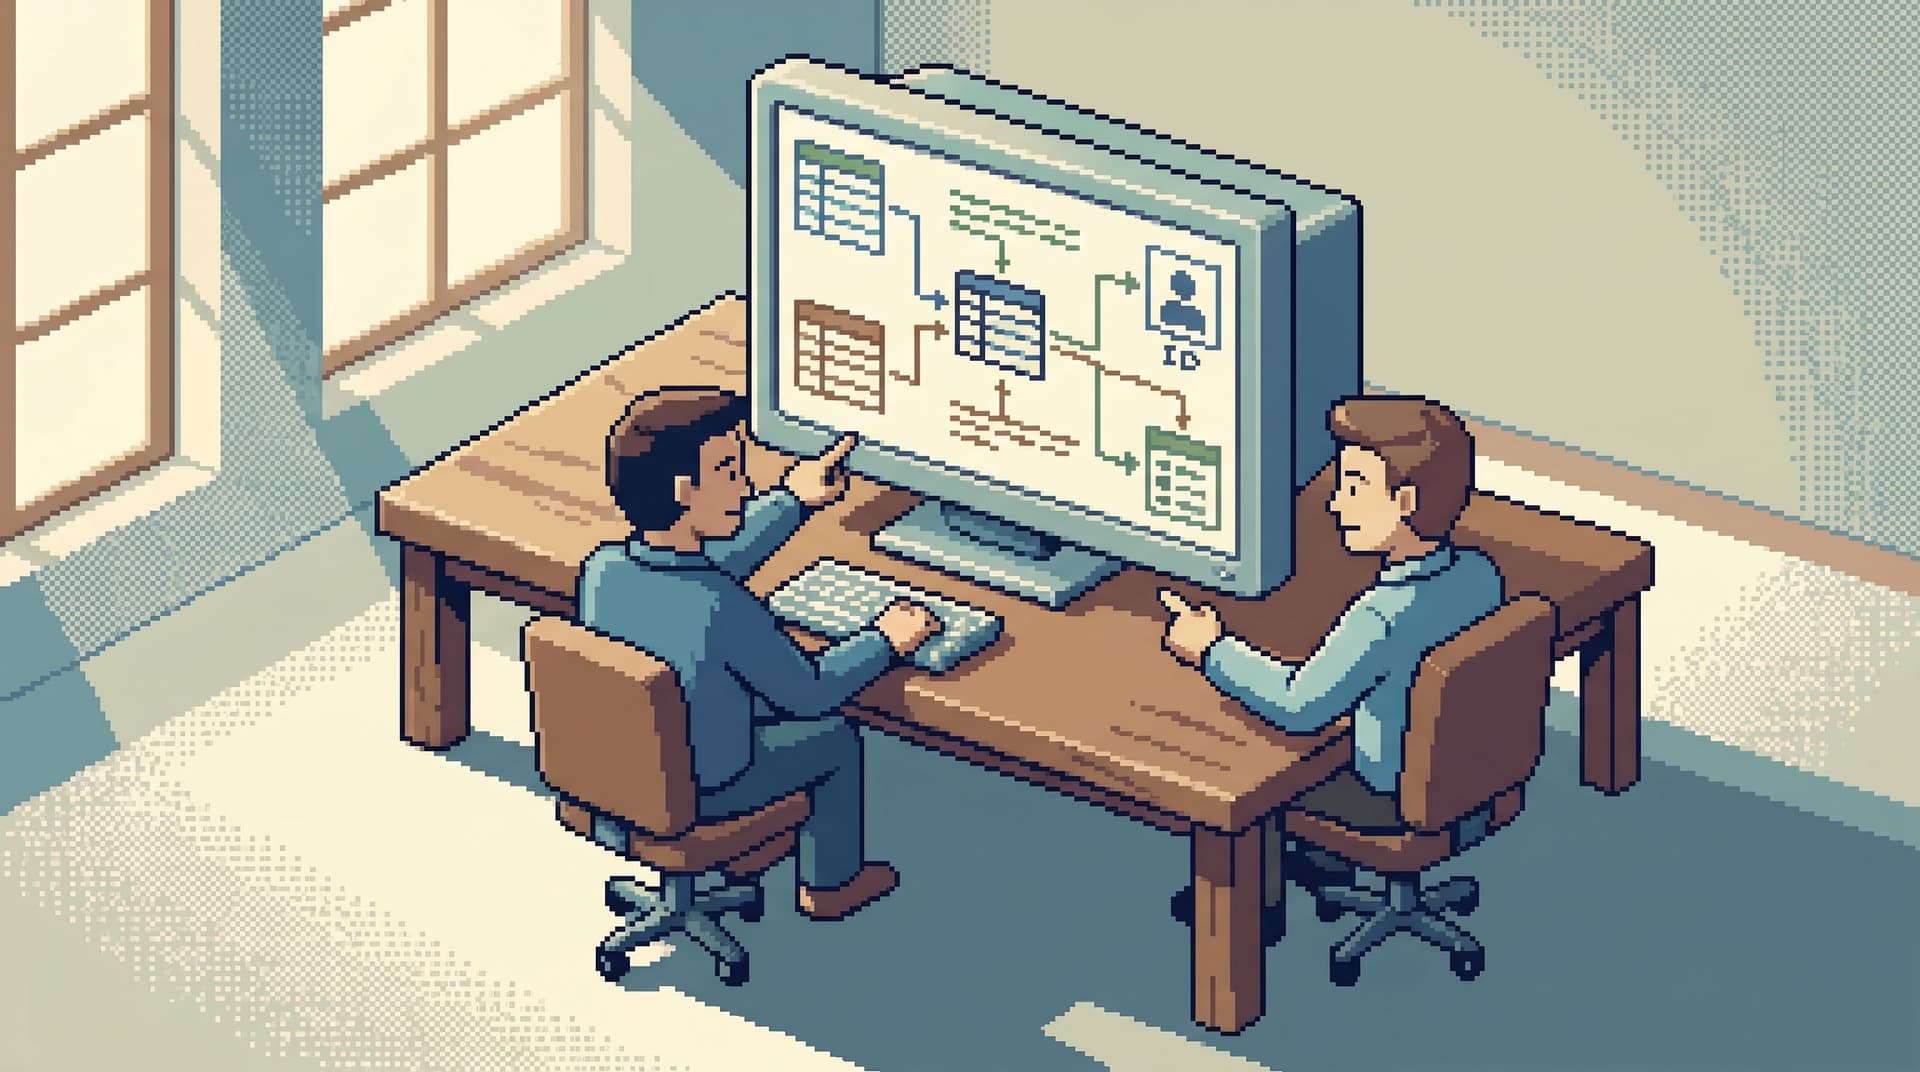
From here, you can follow the user across related tables — orders, invoices, retries — without leaving the window. If you’re using Simpl, this often looks like stepping through an opinionated read path instead of assembling joins from scratch.
We explore this user‑anchor pattern more deeply in Focused Reads in a Microservice World: Following One User Across Many Databases Without Getting Lost.
3. Keep logs and metrics as pointers, not homes
You’ll still need logs and metrics. The shift is how you use them:
- Open your APM or log viewer.
- Find a representative trace or error.
- Extract stable keys:
user_idorder_idpayment_intent_id- timestamp boundaries
- Close the tab once those keys are captured.
Then, back in your main window:
- Use those keys to drive your next reads.
- Stay anchored on that user or order as you move.
The rule of thumb:
If a tab isn’t helping you ask a better question in your primary window, close it.
4. Evolve from ad‑hoc queries to named reads
During an incident, you’ll discover patterns:
- “This join between
payments,refunds, andeventskeeps coming up.” - “We always end up checking feature flags for this tenant.”
Instead of rewriting these each time:
- Save them as named reads or templates.
- Attach them to the incident session.
- Reuse them for the next similar incident.
Over time, these become your team’s quiet incident playbook. We call this posture a post‑query culture — turning one‑off debug work into shared, calm data practices. You can go deeper on that in The Post-Query Culture: How Teams Turn One-Off Debug Sessions into Shared Calm Data Practices.
5. Treat environment switching as a deliberate act
Incidents often require comparing environments:
- Production vs staging
- Before vs after a deploy
In a multi‑tool world, this means more tabs. In an anti‑tab world:
- Use the same primary browser for both environments.
- Switch environments with an explicit control (environment toggle, profile, etc.).
- Keep the same read paths and templates; only the data source changes.
This keeps your mental model stable while you compare states. Our post on The Focused Staging Flow: Using One Opinionated Browser for Both Test and Prod Reads dives into this pattern.
Practical Guardrails That Make This Work
A single‑window incident only works if the window is safe and trustworthy. A few patterns help.
1. Read‑only by default
Under pressure, write access is more danger than power.
- Make your primary incident role read‑only by default.
- Reserve write access for narrow, audited paths (migrations, specific fix scripts).
This reduces the need to open “the real console” in a separate tab when you’re nervous.
2. Scoped entry points
Instead of landing in a blank editor:
- Start from a question‑shaped entry point:
- “Look up user by ID”
- “Inspect last 10 orders for tenant”
- “View recent errors for this feature flag”
These can be simple forms or parameterized queries. The goal is to avoid wandering the schema forest just to get started — a theme we covered in The Post-Explorer Database Browser: Navigating Production by Intent, Not Objects.
3. Built‑in chronology
During an incident, order matters.
Your primary window should give you a chronological view of your own investigation:
- Query A:
user 123 payments - Query B:
user 123 refunds - Query C:
feature flags for tenant X - Query D:
payments for same user in last deploy window
Being able to scroll this timeline is more powerful than ten tabs with slightly different SQL. It lets someone else join mid‑incident and understand the story quickly.
4. Lightweight annotation
You don’t need a full notebook. You need:
- A way to mark a read as “suspect”, “ruled out”, or “confirmed”.
- A small text area to capture “what we think is happening now.”
Those notes, tied to concrete reads, are what turn a one‑off incident into a reusable trail.
Team Habits That Support Anti‑Tab Incidents
Tools are only half the story. The other half is how your team behaves under pressure.
1. Declare the main window at the start
At the beginning of an incident, someone should say explicitly:
- “All production data reads for this incident go through X.”
Then:
- Share a link to the active session in chat.
- Encourage others to watch or pair there, not in their own private tools.
2. Ban private hero consoles (during the incident)
You can’t stop someone from SSH’ing into a box. But you can set a norm:
- If you run a query that influences the incident, it lives in the main window.
- If you discover something in a private console, you re‑create the read in the shared tool.
This keeps the story in one place and reduces the “someone somewhere saw something” effect.
3. Close the loop with a replay
When the incident is resolved:
- Reopen the session in your primary browser.
- Walk through the trail once, end to end.
- Capture a short summary linked to that trail.
Next time a similar alert fires, you’re not starting from zero. You’re starting from a concrete, replayable path.
We explore this “from ticket to tables to code” loop more in From Tickets to Tables to Code: A Straight-Line Workflow for Everyday Production Debugging.
Where a Tool Like Simpl Fits
Simpl is built around this anti‑tab stance:
- One calm, read‑only database browser that becomes the default entry point for production data.
- Opinionated read paths so you can follow a user, order, or incident without bouncing across tools.
- Guardrails by default so incident work feels safe without extra consoles.
- Session‑shaped work so each incident becomes a trail you can replay and refine, not a pile of ad‑hoc queries.
It doesn’t replace your alerts, your logs, or your metrics. It gives you one place to land when those tools tell you something is wrong.
Summary
An anti‑tab debug session is not about aesthetic minimalism. It’s about:
- Owning one primary window for production reads during an incident.
- Treating other tools as pointers, not homes.
- Following a single, coherent trail from alert → data → decision.
- Leaving behind a replayable story, not a collection of private tabs.
The benefits are quiet but compounding:
- Faster decisions with less cognitive overhead.
- Safer reads with fewer risky consoles.
- Stronger team practices as each incident becomes a shared trail, not a solo performance.
Take the First Step
You don’t need a full re‑platform to start.
This week, try one change:
- Pick a single tool to be your primary production read surface.
- For the next incident, run all database reads through that one window.
- At the end, review the trail together and ask:
- Where did we feel forced to open other tools?
- Which reads should become named templates?
- What guardrails would make this feel safer?
If you want a tool designed around this way of working, explore Simpl. It gives your team a calm, opinionated place to run incidents from one browser window — and to turn those incidents into reusable, shared understanding instead of tab‑shaped chaos.