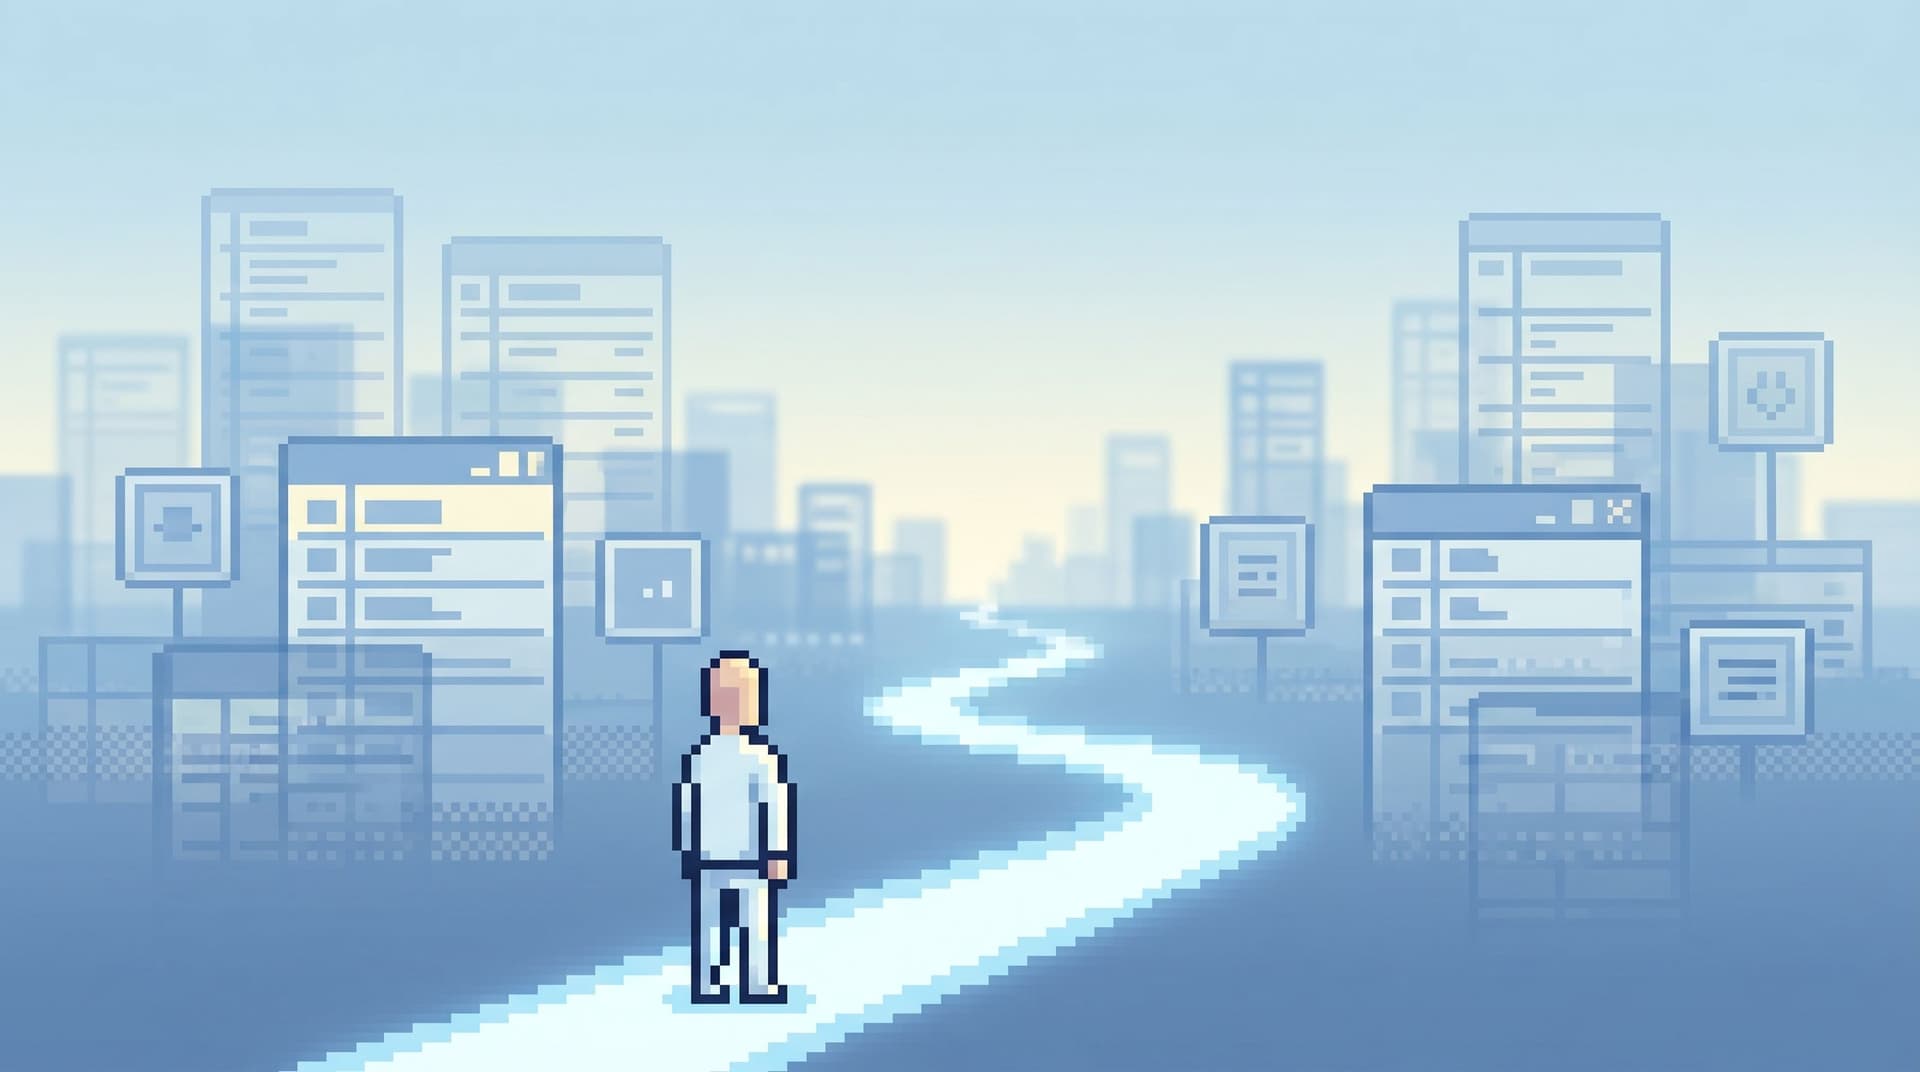
From Tickets to Tables to Code: A Straight-Line Workflow for Everyday Production Debugging

Most production debugging is not heroic.
It’s a support ticket about a failed payment. A Slack message about missing data. A product manager asking why a feature “sometimes” doesn’t work.
None of these should require:
- Five tools
- Three people
- Two hours of wandering from dashboards to consoles to IDEs
But that’s where many teams end up. The path from ticket → data → code is crooked. Context gets dropped. People re-run the same ad‑hoc queries. The loudest tool wins.
There’s a calmer option: treat everyday debugging as a straight-line workflow.
- Start from the ticket, not from a blank console.
- Land in the right tables, not the whole schema.
- Move into the right code, not the whole repo.
This post is about designing that line on purpose—and how a focused database browser like Simpl can sit in the middle as the quiet, opinionated layer between tickets, tables, and code.
Why a Straight Line Matters
Most debugging pain is not about raw difficulty. It’s about friction and fragmentation.
Common symptoms:
- Tickets are vague. “User can’t log in.” No IDs, no timestamps, no links into data.
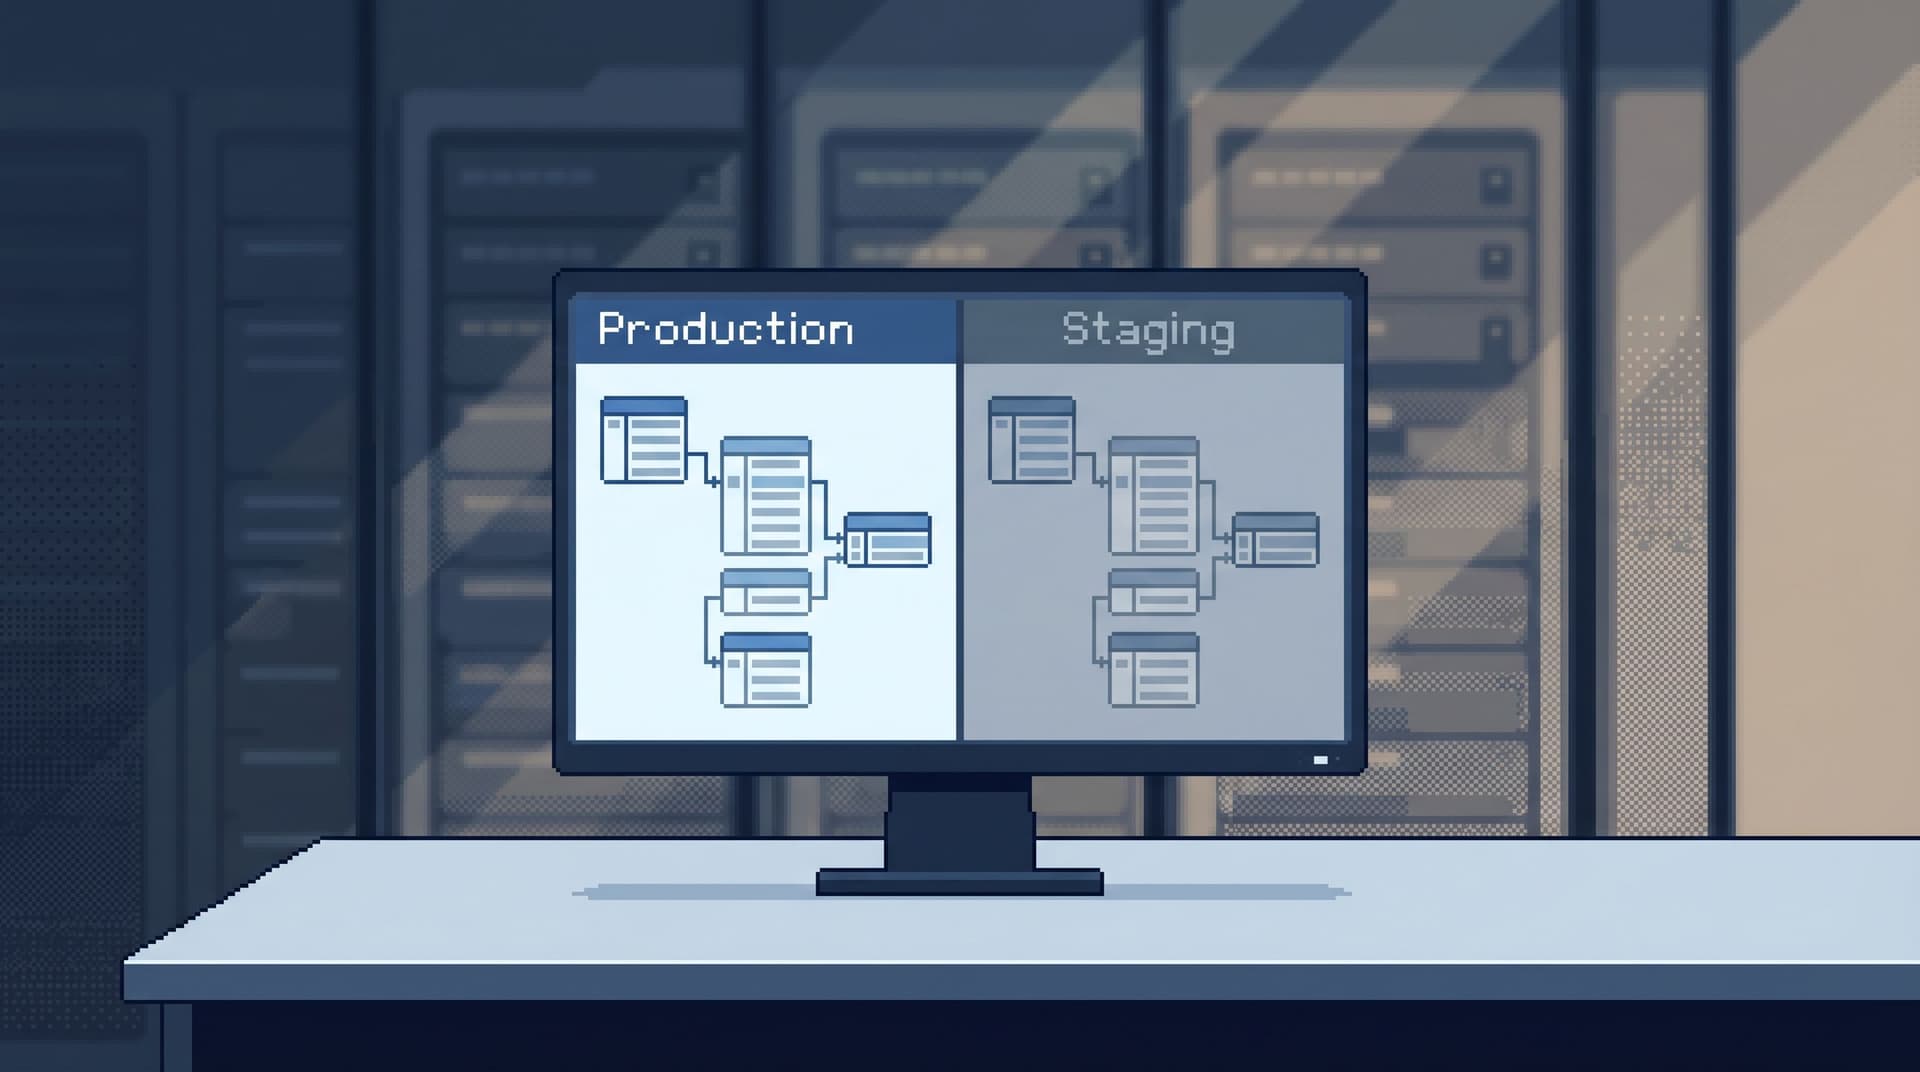
- Data access is noisy. Admin consoles, BI tools, SQL IDEs, staging, production—none clearly “own” the debugging path.
- Code is the last resort. Engineers jump into the codebase before they’ve really read what the data is saying.
The cost isn’t just time. It’s attention.
A straight-line workflow has a few concrete benefits:
-
Shorter incidents, calmer people
You spend less time “getting oriented” and more time reading the few rows that matter. -
Fewer tools per incident
You don’t need a new dashboard for every class of bug. You need a reliable way to walk from the symptom to the rows to the code. -
More people can safely help
When the path is predictable and read‑oriented, you don’t need only the most senior engineer to touch production.
If you’ve read From Tables to Tickets: A Straight-Line Workflow From Alert to Root-Cause Row, this is the other direction: from ticket to tables to code, for the quieter, everyday issues that never trigger an alert.
The Usual Crooked Path
Before designing a straight line, it helps to name the default.
A common flow for a simple bug report:
- Ticket comes in: “Customer says their subscription renewed twice.”
- Someone asks for more info: “Can we get their email? Any screenshots?”
- Support pastes a screenshot from Stripe or a CRM.
- An engineer opens:
- A dashboard to check metrics
- A SQL client to poke at
subscriptionsandpayments - Logs to search by email or user ID
- After a few hops, they find some rows that “look wrong.”
- They jump into the codebase and start grepping for
SubscriptionRenewalJob.
This works. But it’s noisy:
- The ticket is a dead end. It doesn’t link to anything.
- The data is found ad‑hoc, by memory of which tables “probably” matter.
- The code is reached by guesswork instead of by following clear data evidence.
You can’t remove all the uncertainty. But you can remove a lot of the wandering.
A Calm, Straight-Line Model
A straight-line workflow for production debugging has three anchors:
-
Tickets capture identifiers.
Every ticket that touches real users or jobs includes the concrete keys you’ll need: user IDs, order IDs, job IDs, timestamps. -
Tables are reached via opinionated trails, not schema trees.
You don’t expand a schema tree and hope. You click one or two well‑named entry points that encode your usual investigations. -
Code is reached from the story the rows are telling.
Once you can see exactly what happened in data, the jump into code is narrow: one or two functions, one or two services.
From Tickets to Trails: Designing Opinionated Paths from Jira Issues into Live Data goes deep on the first and second anchors. Here, we’ll focus on the full arc: how to go ticket → tables → code without losing the thread.
Step 1: Make Tickets Data-Ready by Default
A straight line starts at the first touchpoint.
Most teams can’t change their ticketing system overnight. But you can change your ticket hygiene.
For any issue that might touch production data, make these fields non‑optional:
-
Primary identifier
- User ID, customer ID, account ID, or similar
- If support only has email or username, define a reliable way to map that to an internal ID
-
Secondary context
- One of: order ID, invoice ID, job ID, session ID, request ID
- Enough to distinguish “this specific operation” from the user’s entire history
-
Time window
- Rough timestamp, plus timezone
- Even a 10–15 minute window helps filter logs and queries
-
Environment
- Production vs staging vs sandbox
A simple internal checklist in the ticket template goes a long way:
- [ ] User identifier (ID or email)
- [ ] Operation identifier (order, job, request)
- [ ] Time window
- [ ] Environment
The goal is not bureaucracy. The goal is that when an engineer opens a ticket, they can immediately:
- Plug the user ID into a stable lookup trail in Simpl
- Filter logs by request ID
- Cross‑check a specific job or order
You’re designing for the moment when someone is on call, tired, and has 10 minutes before their next meeting.

Step 2: Land in the Right Tables Without the Schema Tour
Once you have identifiers, the next question is: where do you go first?
Many teams default to:
- Opening a SQL IDE
- Connecting to production
- Expanding the schema tree
- Guessing which table to start with
That’s the map‑first approach we unpacked in Database Work Without the Map: Navigating Production by Question, Not Schema or Service. It’s flexible, but under pressure it’s noisy.
Instead, define a small set of question‑first entry points—opinionated trails that encode how you usually debug.
Examples:
-
“What’s happening with this user?”
- Trail:
users→subscriptions→payments→events - Inputs:
user_id
- Trail:
-
“Why did this job behave strangely?”
- Trail:
jobs→job_executions→ relatedentities(orders, invoices) - Inputs:
job_idorcorrelation_id
- Trail:
-
“Why does this order look wrong?”
- Trail:
orders→order_items→payments→shipments - Inputs:
order_id
- Trail:
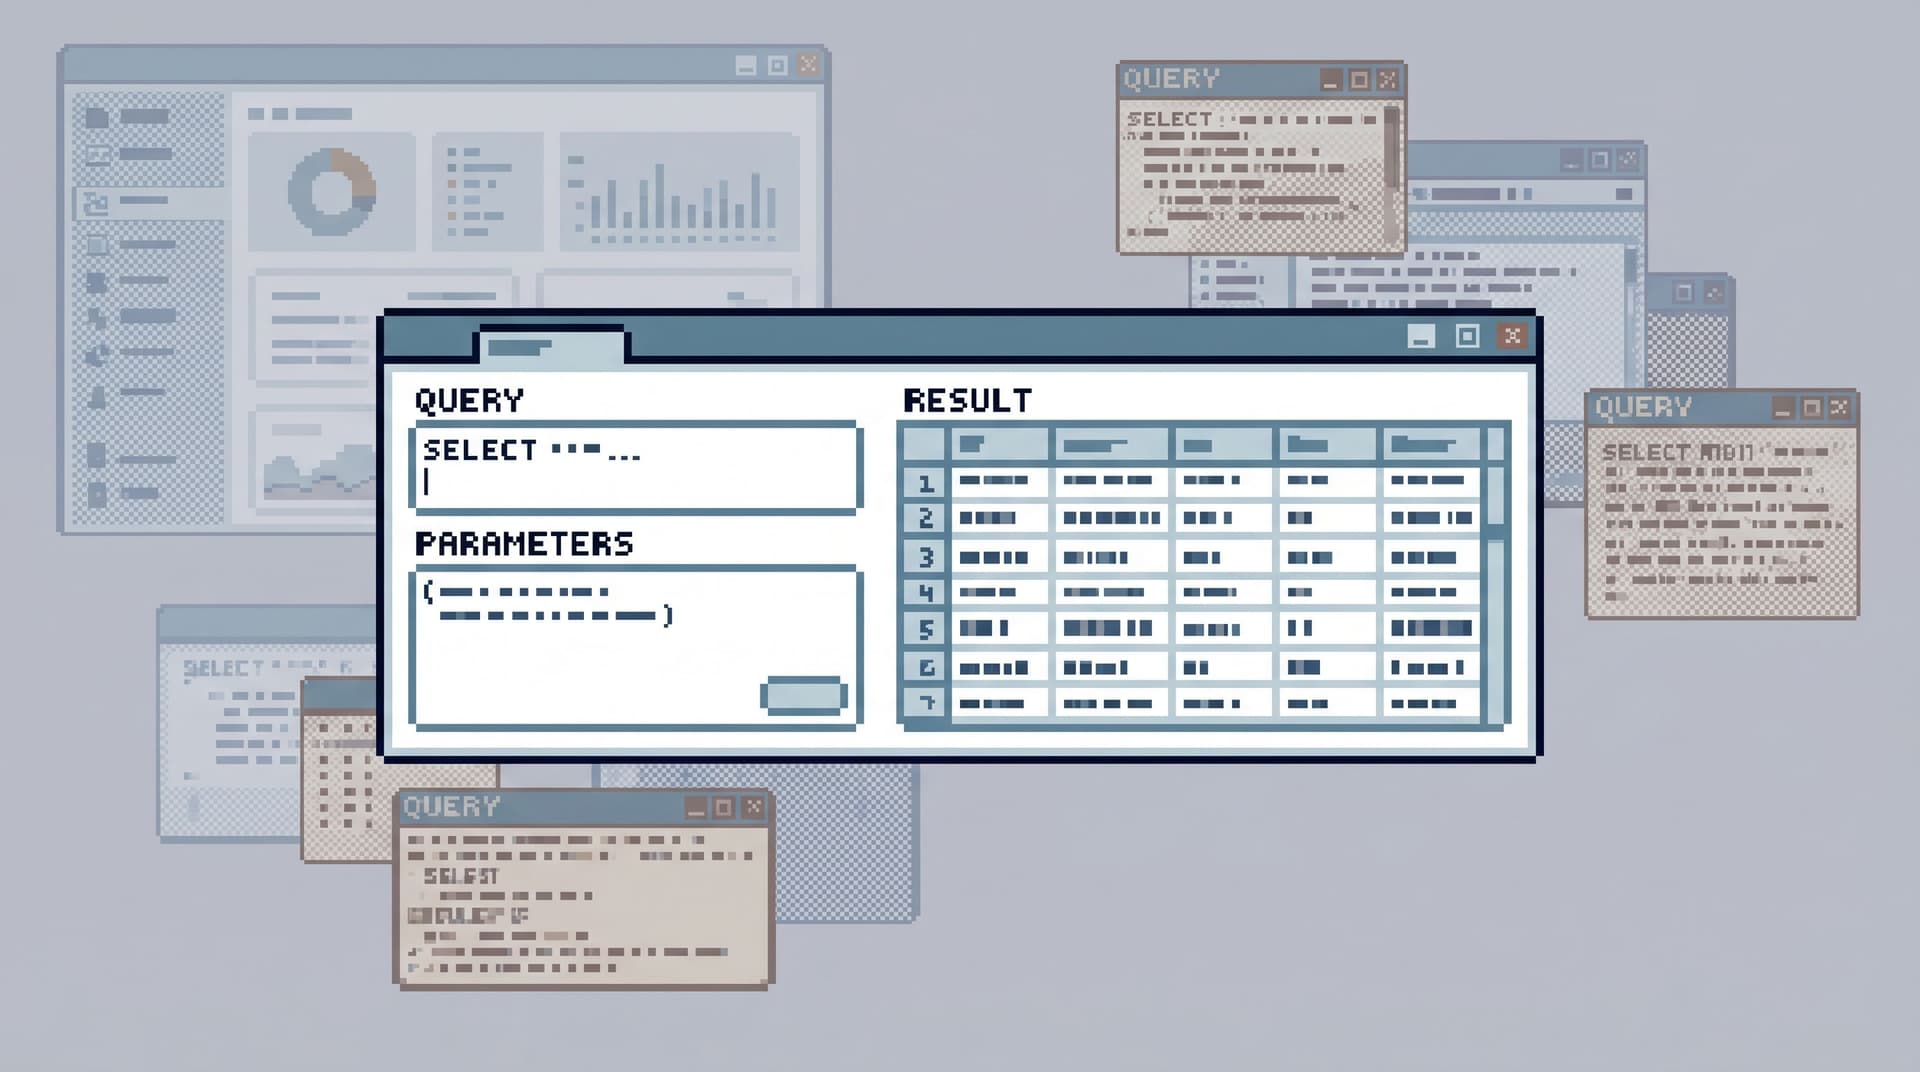
In a tool like Simpl, these can be encoded as:
- Saved, parameterized queries with clear names
- Linked views that jump from one table to the next based on keys
- Opinionated pagination and filters that keep you near the relevant rows
The key properties of a good entry trail:
- Narrow – answers one kind of question well
- Stable – doesn’t change every week with minor schema tweaks
- Composable – easy to hop from one trail to another via shared keys
When a ticket arrives, the engineer should be able to:
- Copy the user ID from the ticket.
- Open the “User Debug” trail in Simpl.
- Paste the ID and immediately see:
- The user row
- Recent subscriptions
- Relevant payments or jobs
No schema browsing. No guesswork. Just a calm, opinionated path from identifiers to the story in the data.
Step 3: Read the Data as a Story, Not a Dump
Landing in the right tables is necessary but not sufficient. A straight line breaks if your first move is still SELECT * on a hot table.
A few small habits make production reads feel safer and more informative:
-
Start with summaries, then zoom.
- First query: narrow columns, tight predicates, recent time window.
- Only then expand to more columns or a wider time range.
-
Prefer “slices” over “everything.”
- For user issues: last 10 events, last 5 payments, last 3 jobs.
- For job issues: last N executions, grouped by status.
-
Use consistent ordering.
- Always sort by
created_atoroccurred_atin the same direction. - This makes it easy to compare trails across tickets.
- Always sort by
-
Make filters explicit.
- Include environment, status, and time window in every investigative query.
- Avoid “accidentally” mixing staging and production or active and archived rows.
These habits are the focus of posts like Beyond ‘SELECT *’: Small Query Habits That Make Production Databases Feel Safer. Encoding them into your trails—rather than relying on memory—keeps the workflow calm under pressure.
In a browser like Simpl, this looks like:
- Pre‑filtered views for “recent activity for this user”
- Opinionated pagination (e.g., cursor‑based, limited window) so you don’t scroll forever
- Soft guardrails that make dangerous queries hard to express by accident
You’re not just getting to the tables faster. You’re reading them in a way that naturally leads to the right code questions.

Step 4: Let the Rows Point to the Code
Once you have the relevant rows on screen, the temptation is to jump straight to the repo and start searching by intuition:
- “This looks like a billing issue; I’ll check the
billingservice.” - “That timestamp is weird; maybe the cron job is misconfigured.”
A straight-line workflow instead asks: What is this row actually telling me?
Look for:
-
State transitions
statusfields changing in unexpected waysupdated_attimestamps that don’t match expected flows
-
Missing or duplicated links
- An order without a payment
- Two payments for one order
- Jobs without corresponding domain entities
-
Invariants that should never break
- Negative quantities
- Overlapping date ranges
- Impossible enum combinations
Each of these clues should map to a small number of code paths:
- State transitions ↔ specific state machine or workflow functions
- Missing links ↔ creation and association logic
- Broken invariants ↔ validation or reconciliation code
Concretely:
-
Identify the smallest surprising fact in the data.
“This subscription has two active payments for the same period.” -
Translate it into a code question.
“Where do we create payments for subscriptions, and how do we enforce uniqueness per period?” -
Jump into the repo with that question, not with a vague sense of the service.
This is where pairing a browser like Simpl with your editor pays off. You’re not alt‑tabbing randomly. You’re following a narrow, data‑shaped thread into a specific part of the code.
Step 5: Close the Loop Back to the Ticket
A straight line is not just about getting from ticket to code. It’s about coming back with a clear, documented story.
Once you’ve understood the issue and, ideally, fixed it:
-
Capture the path you took.
- Which trails or queries did you use?
- Which identifiers mattered?
- Which invariants were violated?
-
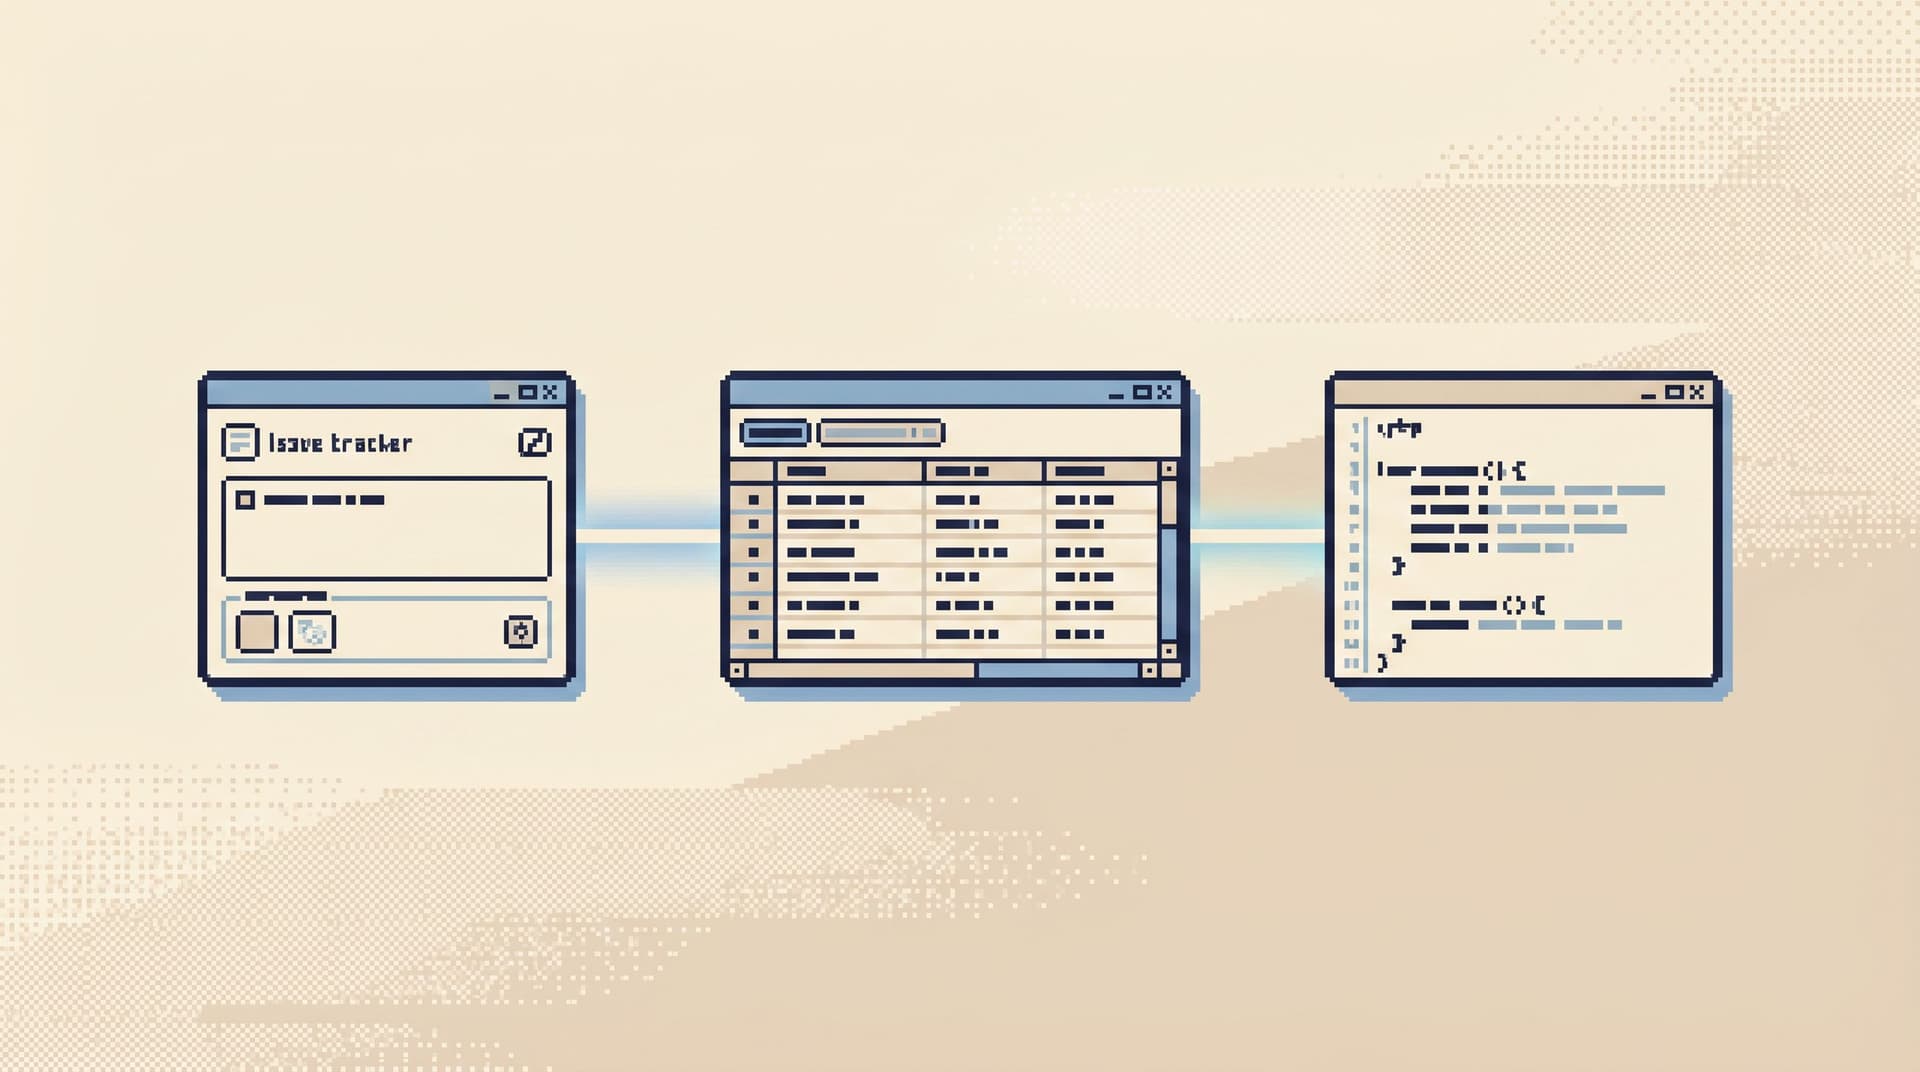
Turn that into a reusable trail or runbook.
- If this bug could happen again, encode the investigation as a named trail or parameterized query.
- Tools like Simpl are built for this: turning common investigative paths into calm, repeatable “runbooks in SQL,” as we explored in Beyond Saved Views: Turning Common Production Reads into Opinionated ‘Runbooks in SQL’.
-
Link it from the ticket.
- Instead of a screenshot, paste a link to the exact view or trail you used.
- Future readers can re‑run the same investigation with updated data.
Over time, this turns your debugging workflow into a shared asset:
- New engineers don’t start from a blank console.
- On‑call rotations feel less like “figure it out as you go” and more like “follow the known paths first.”
- Your query history becomes a knowledge base, not just exhaust.
Putting It All Together: A Straight-Line Checklist
You don’t need a full process rewrite to get value from this. You can start with a few small moves.
For every new ticket that touches production data:
-
Enforce identifiers.
- Make sure user IDs, order IDs, job IDs, and time windows are present.
-
Start from a trail, not a schema.
- Use a question‑first entry point in Simpl or your database browser.
-
Read safely and narrowly.
- Start with tight filters and minimal columns.
- Let the data tell you what’s surprising.
-
Let data choose the code.
- Formulate a specific code question based on what the rows show.
- Jump into the repo with that question in hand.
-
Leave a breadcrumb.
- Save or refine the trail you used.
- Link it back into the ticket for future you (or someone else).
Do this a handful of times, and you’ll notice something: everyday debugging feels less like “hero work” and more like walking a familiar path.
Summary
Everyday production debugging doesn’t need to be chaotic.
A calm, straight-line workflow from tickets → tables → code rests on a few opinions:
- Tickets should include the identifiers you’ll actually use.
- Database access should start from question‑first trails, not schema trees.
- Reading data should feel like following a story, not dumping rows.
- Code should be reached through the smallest surprising fact in the data.
- Each investigation should leave behind a reusable trail, not just a Slack thread.
A focused database browser like Simpl is built for this middle layer: not BI, not admin, but the quiet, everyday work of reading production data calmly and turning those reads into repeatable paths.
Take the First Step
You don’t need to redesign your stack to get started.
Pick one of these as your first move:
- Add a short “data‑ready” checklist to your ticket template.
- Define a single “User Debug” trail that starts from
user_idand walks through the 2–3 tables you always end up querying. - The next time you debug an issue, save the queries you actually used and turn them into a named, parameterized trail instead of leaving them in history.
If you want a place where those trails can live—quietly, safely, and close to production—try running them through Simpl. See what changes when the path from ticket to tables to code is not an adventure, but a straight line you can trust.