Database Work Without Dashboards: A Minimalist Stack for Everyday Debugging

Dashboards used to be the default answer to any production question.
A graph for signups. A panel for latency. A heatmap for errors. When something looked off, you opened more charts.
But most concrete questions don’t end on a dashboard. They end on rows:
- Which users were actually affected?
- What did this invoice look like before and after the bug?
- Which jobs failed, and what did they have in common?
Dashboards are good at showing that something is wrong. They’re rarely the best place to understand what actually happened.
This post is an argument for a quieter pattern: database work without dashboards as the primary surface. A minimalist stack that treats charts as a supporting detail, not the main event.
It’s also an argument for doing that work from a calm, opinionated browser like Simpl, instead of juggling a BI tool, three admin panels, and a SQL IDE every time you need to debug.
Why move beyond dashboards for everyday debugging?
Dashboards are optimized for:
- Monitoring trends over time
- Communicating health and KPIs to others
- Scanning for anomalies at a glance
They are not optimized for:
- Walking a single user’s journey through your system
- Reconstructing the story of one broken invoice or job
- Answering narrow, high‑intent questions under pressure
When you lean on dashboards for everyday debugging, a few things happen:
-
You debug by shape, not by story.
You see a spike in failures, then bounce between panels trying to guess why. The narrative lives in your head, not in the tool. -
You fragment your attention.
One dashboard for metrics, another for traces, another for logs. Then a separate surface for rows. Each context switch is a chance to lose the original question. -
You over‑optimize the wrong layer.
You spend time tweaking charts and thresholds instead of making the path from “alert” to “rows” calm and repeatable.
If this feels familiar, you might find it helpful to pair this post with two others:
- How to keep a single narrative running through your debug sessions: From Data Wandering to Data Walkthroughs: Structuring Calm Narratives for Debug Sessions
- How to shrink the overall stack around this work: The Quiet DX Roadmap: How to Shrink Your Data Tool Stack in Six Calm Steps
The core idea here: dashboards are a monitoring tool; debugging is a storytelling activity. Your stack should reflect that.
A minimalist stack for everyday debugging
You don’t need ten tools to debug production calmly.
You need a small set of opinionated surfaces that work well together:
-
One calm database browser (read‑only, opinionated, row‑first)
This is where you actually do most of the work. A tool like Simpl should be:- Read‑focused by default
- Built around rows, not schema trees and dashboards
- Opinionated about pagination, filters, and time travel
-
One lightweight SQL editor (for the rare query that doesn’t fit the browser)
This is where you write the occasional custom query, often locally in your editor or a focused SQL IDE. -
One observability surface (logs + traces + basic metrics)
This is where you notice that something is wrong and grab enough context (IDs, timestamps, error codes) to jump into rows.
That’s it.
Dashboards still exist, but they move to the background:
- You use them to track long‑term behavior and communicate trends.
- You don’t use them as the primary workspace for everyday debugging.
The rest of this post is about how to actually work this way.
Start from one question, not one dashboard
Debugging without dashboards starts before you open any tool.
Begin with a single, concrete question:
“What happened to this specific thing between these two moments?”
For example:
- “Why did user 123 get two invoices on July 1?”
- “Why did job 987 retry five times around 09:12 UTC?”
- “Why did this feature flag appear off for this request?”
Write that question down somewhere visible:
- In the description of your incident
- In the title of your Simpl session
- In a small note in your editor
Then apply one constraint:
Only open tools that help you answer that one question.
If a dashboard helps you confirm that “yes, failures spiked around that time”, open it briefly, grab the context, then close it. Don’t stay there.
For a deeper dive into this posture, see Database Work Without Multitasking: Running a Whole Debug Session From One Intent.
Run the debug from rows, not charts
Once you have the question, move quickly into rows. That’s where the story lives.
Here’s a simple pattern you can run almost every time.
1. Anchor on a primary entity
Pick the entity that best represents the real‑world thing you care about:
- User
- Invoice
- Subscription
- Job / task
- Order
In a browser like Simpl:
- Open the primary table (e.g.,
invoices). - Filter by a stable identifier (invoice ID, external reference, or user ID + date).
- Land on one row that clearly matches your question.
This is your anchor.
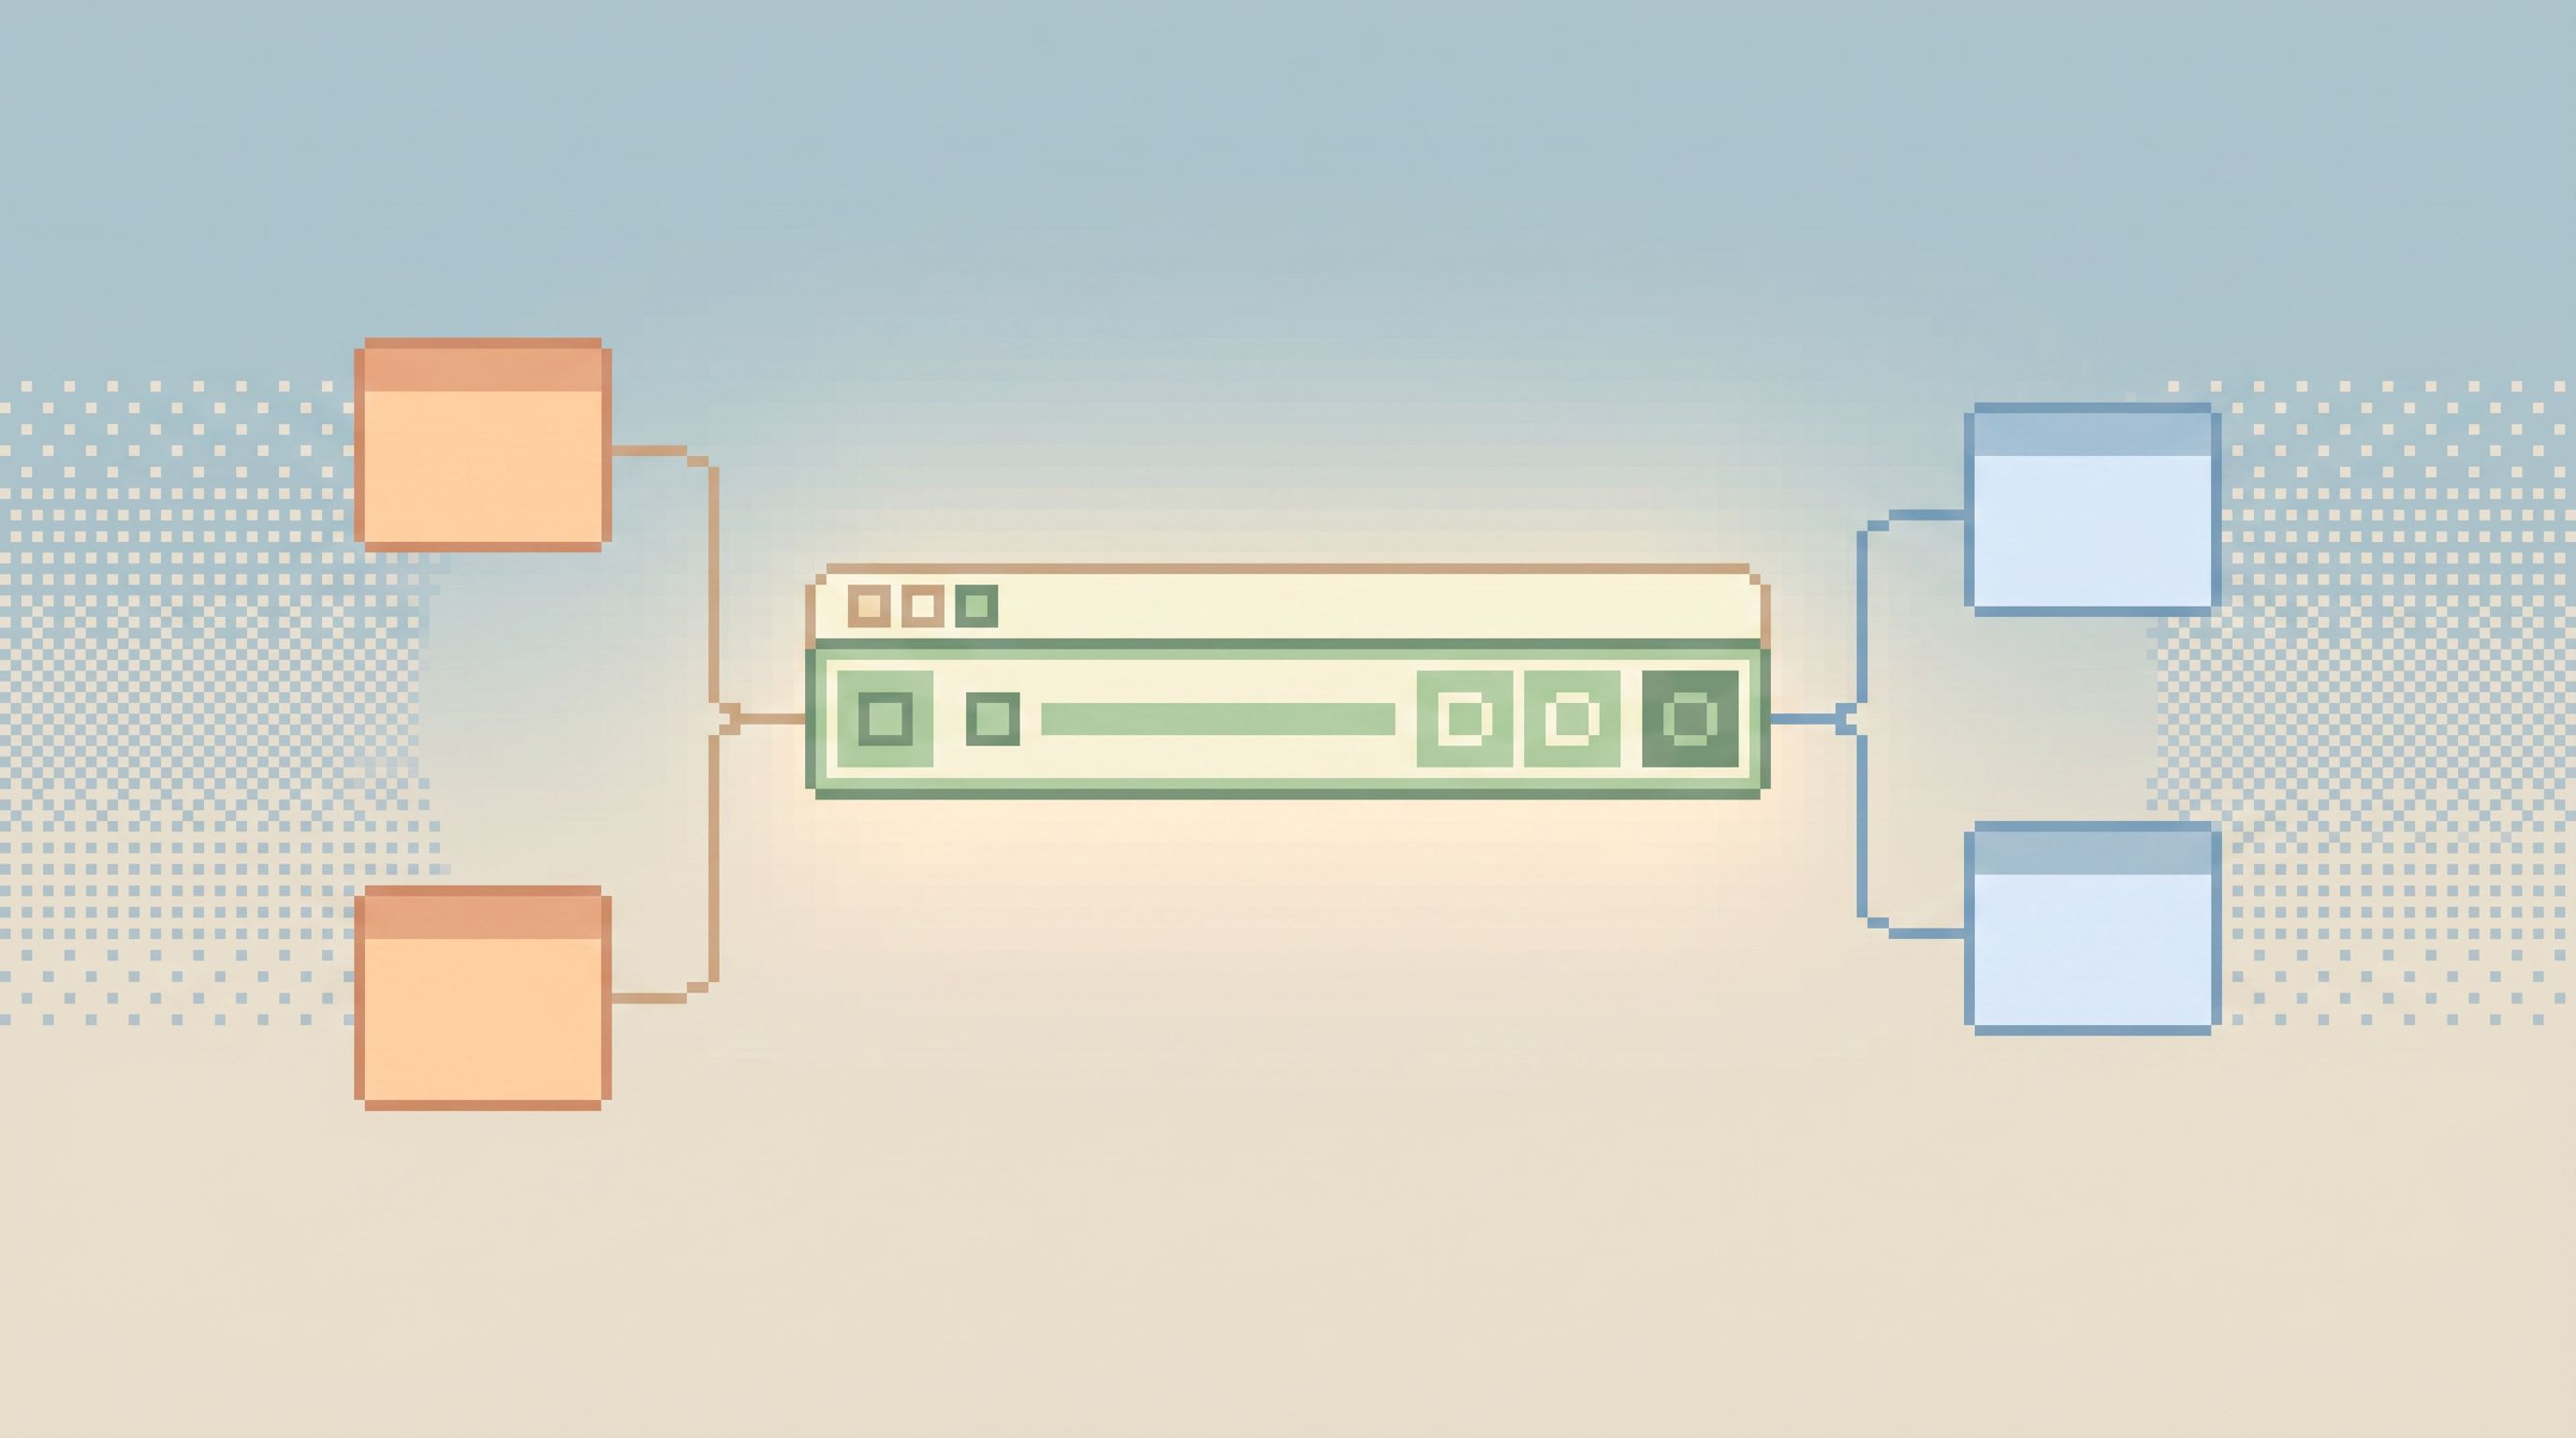
2. Walk the immediate relationships
From that anchor row, follow only the relationships that matter to the question:
- Foreign keys (user, subscription, plan, job)
- Direct children (line items, events, logs)
- Relevant status transitions
A calm browser should make this feel like reading a story, not spelunking a schema. Opinionated navigation patterns—like those we described in Beyond Object Trees: Intent‑First Navigation Patterns for Modern Database Browsers—help here.
As you walk:
- Stay linear. Avoid branching into three unrelated paths at once.
- Stay local. Don’t jump to tables that aren’t clearly tied to your anchor.
3. Add time as a first‑class dimension
Most real questions are time questions:
- “What did this look like before the change?”
- “What changed between these two events?”
You want your stack to make time travel feel natural:
- Event tables with clear timestamps
- Versioned records or audit logs
- Snapshots or history tables you can read without fear
In a tool like Simpl, that might look like:
- A side‑by‑side view of current vs. historical versions
- A simple control to filter events between two timestamps
- A timeline view for a single entity, not the whole system
If you’re designing your own patterns here, Opinionated Time Travel: Calm Patterns for Reading Historical States in Production Data goes deeper.
4. Use metrics as context, not as the stage
Metrics still matter. The difference is where they live in your workflow.
A calmer pattern:
- Glance at metrics or a dashboard once to:
- Confirm that your local story matches the global shape
- Check whether your entity is part of a broader wave of similar issues
- Then go back to rows and finish the narrative there.
You’re using dashboards the way you might use weather: helpful context, not the main task.
A practical “no‑dashboard” workflow for a typical bug
Let’s make this concrete.
Scenario: Support reports that a customer was charged twice for the same invoice.
Here’s how a minimalist, row‑first stack might handle it.
-
Capture the question.
“Why did customercust_123receive two charges for invoiceinv_456on July 1?” -
Jump straight to rows in Simpl.
- Open
invoices. - Filter by
inv_456. - Confirm the invoice exists and see its current state.
- Open
-
Walk the relationships.
- Follow the
customer_idto see other invoices around that date. - Follow
payment_intent_idorcharge_idto a payments table or external reference. - Follow any
invoice_events/payments_eventstables for that invoice.
- Follow the
-
Layer in time.
- Filter
invoice_eventsforinv_456between2026-07-01 00:00and2026-07-02 00:00. - Look for duplicate
chargedorpaidevents. - Compare timestamps with any retries or webhook failures.
- Filter
-
Use observability for context only.
- In your log/trace tool, search for
inv_456around the same timestamps. - Confirm whether the handler retried, threw, or double‑called a payment API.
- Grab request IDs if needed, then return to rows.
- In your log/trace tool, search for
-
Write down the story as rows, not charts.
- At
09:12:03, invoice created with amount X. - At
09:12:05, payment attempt #1 started. - At
09:12:07, payment API returned timeout, but charge succeeded. - At
09:12:10, retry triggered, second charge created.
- At
-
Optionally confirm with a metric.
- Open a small chart or dashboard showing payment errors or retries for that window.
- Confirm that this invoice is part of a cluster of similar failures.
- Close the dashboard.
The key move: rows first, metrics second.
You never needed a custom dashboard to answer the support question. You needed:
- A calm browser
- A clear question
- A linear path through related rows

Tooling principles for a no‑dashboard stack
If you want to support this style of work, you can use these principles to evaluate or design tools.
1. Rows are first‑class
Your primary surface should:
- Open quickly on a single table with sensible defaults
- Make it trivial to filter by IDs, timestamps, and statuses
- Show related rows (via foreign keys or events) without schema spelunking
This is where a browser like Simpl is intentionally narrow: it’s not a BI tool, not a notebook, not a schema designer. It’s a calm place to read production data.
2. Read‑only by default
Everyday debugging rarely needs write access.
A read‑only posture:
- Lowers the stress of working in production
- Makes it easier to give more people access to real data
- Encourages better patterns for fixes (migrations, scripts, code) instead of ad‑hoc edits
For more on this, see The Post-Admin Session: What Everyday Production Reads Look Like in a Read‑Only World.
3. Intent over layout
You don’t need custom dashboards or drag‑and‑drop layouts.
You need:
- A clear entry point: “What are you trying to understand?”
- A few opinionated navigation paths based on that intent
- A linear history of where you’ve been in this session
This is the opposite of a workspace full of tiles and tabs. We explore this more in The Post-Workspace Browser: Database Debugging Without Tabs, Tiles, or Timelines.
4. One quiet path from signal to row
When an alert fires or someone posts an error in chat, the path to rows should be:
- Repeatable: same sequence every time
- Short: a handful of clicks, not a hunt through five tools
- Shareable: easy for someone else to retrace your steps
A simple pattern:
- Alert / error → 2. Logs / traces to extract IDs → 3. Simpl session anchored on those IDs → 4. Narrative written from rows.
Small habits that keep you out of dashboard sprawl
You can adopt this posture even if your stack is still heavy on dashboards.
Try a few small constraints for a week:
-
Write the question before opening any tool.
One sentence. One entity. One time window. -
Start in rows at least once per incident.
Even if you glance at a dashboard first, commit to landing in rows quickly. -
Close dashboards when you’re done with them.
Don’t leave them open as ambient noise. -
Bookmark row‑level views, not dashboards.
Save links that go directly to a filtered table or entity view in Simpl, not a generic wall of charts. -
Tell the story in terms of rows.
When you write the incident summary, describe:- Which entities were affected
- What changed in their records
- How that change lined up with logs, traces, or external systems
Over time, these habits shift the center of gravity of your debugging work—from dashboards to data.
Summary
Database work without dashboards is not about deleting charts.
It’s about moving the center of gravity of your debugging sessions:
- From dashboards as the place you work → to dashboards as background context
- From many tools and layouts → to one calm, row‑first surface
- From wandering metrics → to linear narratives grounded in actual entities
A minimalist stack for everyday debugging looks like:
- One opinionated database browser like Simpl for focused, read‑only work on rows
- One lightweight SQL editor for the rare custom query
- One observability surface for logs, traces, and a few essential metrics
On top of that, you layer a few habits:
- Start from one question
- Anchor on a primary entity
- Walk relationships and time linearly
- Use dashboards as context, not the main stage
The result is quieter debugging: fewer tabs, fewer dashboards, and more time actually understanding what happened.
Take the first step
You don’t have to redesign your entire stack to get value from this posture.
Pick one small move:
- Choose a primary browser. If you don’t have one, try Simpl as the calm default for production reads.
- Run your next incident from rows. Start with the entity, not the dashboard. See how far you can get before you need a chart.
- Retire one dashboard. Find a panel that mostly duplicates what you now read from rows and archive it.
The goal isn’t fewer tools for their own sake. It’s a quieter, more legible way to answer real questions from your data—one row, one story, one session at a time.