The Read-First Incident: Running Postmortems from a Single Calm Query Trail

Most incident reviews quietly fail before they start.
Not because people don’t care, or because there isn’t enough data, but because the story of the incident is scattered:
- A few screenshots in Slack
- Some ad‑hoc queries in someone’s local SQL client
- A dashboard link or two
- Snippets from logs and traces
By the time you get to the postmortem, everyone is reconstructing the incident from memory. The “facts” are whatever someone remembered to paste into a document.
There’s a calmer way to work: treat each incident as a read‑first investigation with a single, linear query trail you can replay later.
This post is about structuring incidents so the database side of the story is:
- Read‑only by default
- Linear instead of branching
- Captured as a shareable trail, not ephemeral queries
Tools like Simpl are built around that stance: opinionated, read‑first database browsing that makes incident narratives something you can see, not just remember.
Why incidents should be read‑first by default
Most production incidents are, at their core, questions about what already happened:
- Did this job run once or twice?
- Which version of the payload did we store?
- When did this user’s state change, and why?
These are read questions. Yet the tools we use for incidents often mix reads and writes, exploration and mutation, dashboards and drilldowns.
That has a few predictable side effects:
- Risk creeps in. Even if nobody runs
UPDATEon production during an incident, the possibility is there. That changes how people feel and behave. - Context fragments. Queries live in local history, terminals, browser tabs. No one sees the full trail.
- Postmortems become archaeology. You’re digging through artifacts instead of replaying a clear narrative.
A read‑first incident workflow flips the defaults:
- The primary database surface is read‑only.
- The session is structured as one linear trail of queries, each tied to the question it answers.
- That trail is saved and shareable as the raw material for the postmortem.
If this sounds familiar, it’s the same philosophy behind the anti‑admin stance in Beyond Admin Panels: What a Purpose-Built Database Browser Should (and Shouldn’t) Do: everyday engineering work deserves a smaller, calmer database tool.
From log soup to a single calm trail
During an incident, your team is already juggling:
- Alerts and dashboards
- Logs and traces
- Feature flags and deploy history
The database should not add another maze.
Instead, aim for one primary query trail per incident:
- A single place where you look at production data
- A single path from first question to final understanding
- A single artifact you can bring into the postmortem
This is the same idea as the one‑query stance in The One-Query Mindset: Structuring Database Work to Avoid Cognitive Thrash: less surface area, more clarity.
In practice, that means:
- No tab explosion in your SQL client
- No parallel “just in case” explorations
- No copy‑pasted queries with slightly different WHERE clauses floating around Slack
You work through the incident as a story, not as a pile of disconnected reads.
What a “read‑first incident” actually looks like
Let’s make this concrete. Imagine a subscription bug:
Some users were charged twice after updating their plan.
A noisy approach might look like:
- Three engineers open different SQL clients
- One person pokes around in an admin panel
- Someone else scrolls logs and screenshots rows into Slack
A read‑first, single‑trail approach looks different.
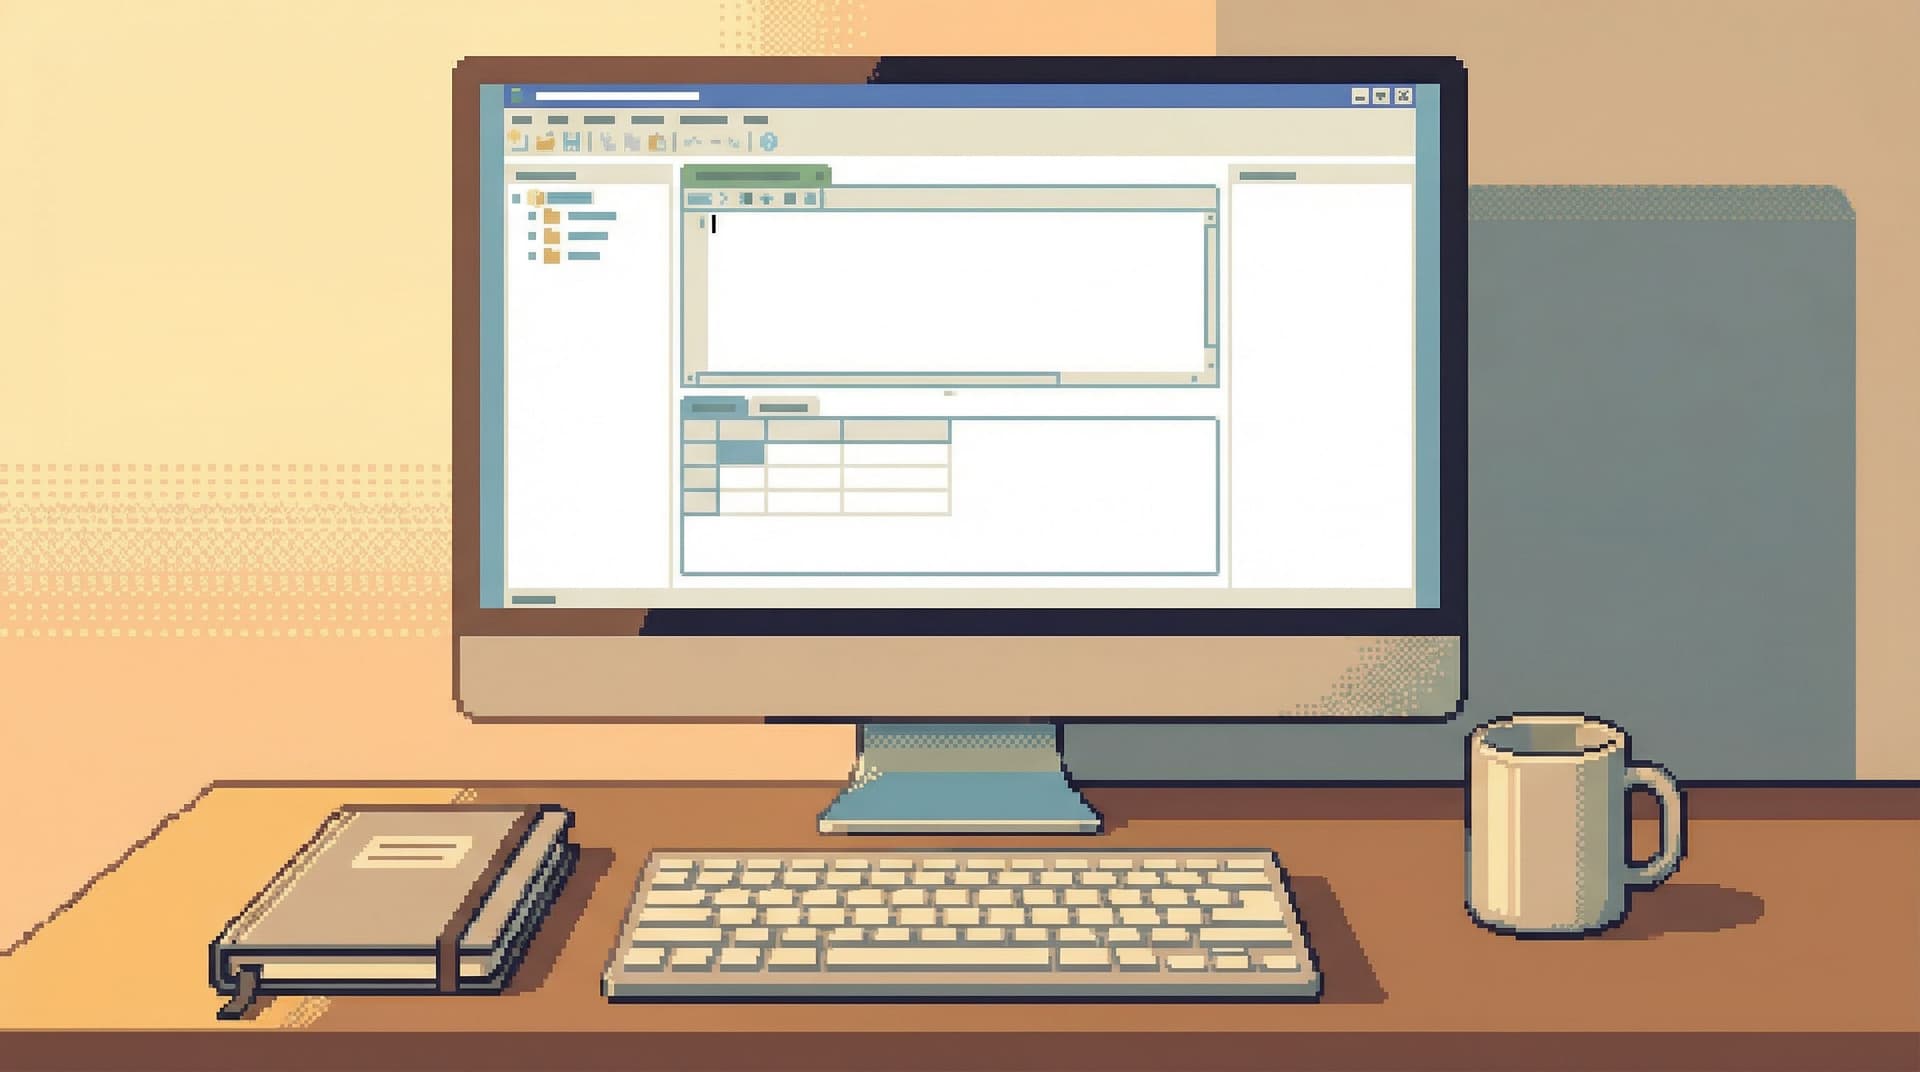
1. Declare the database surface
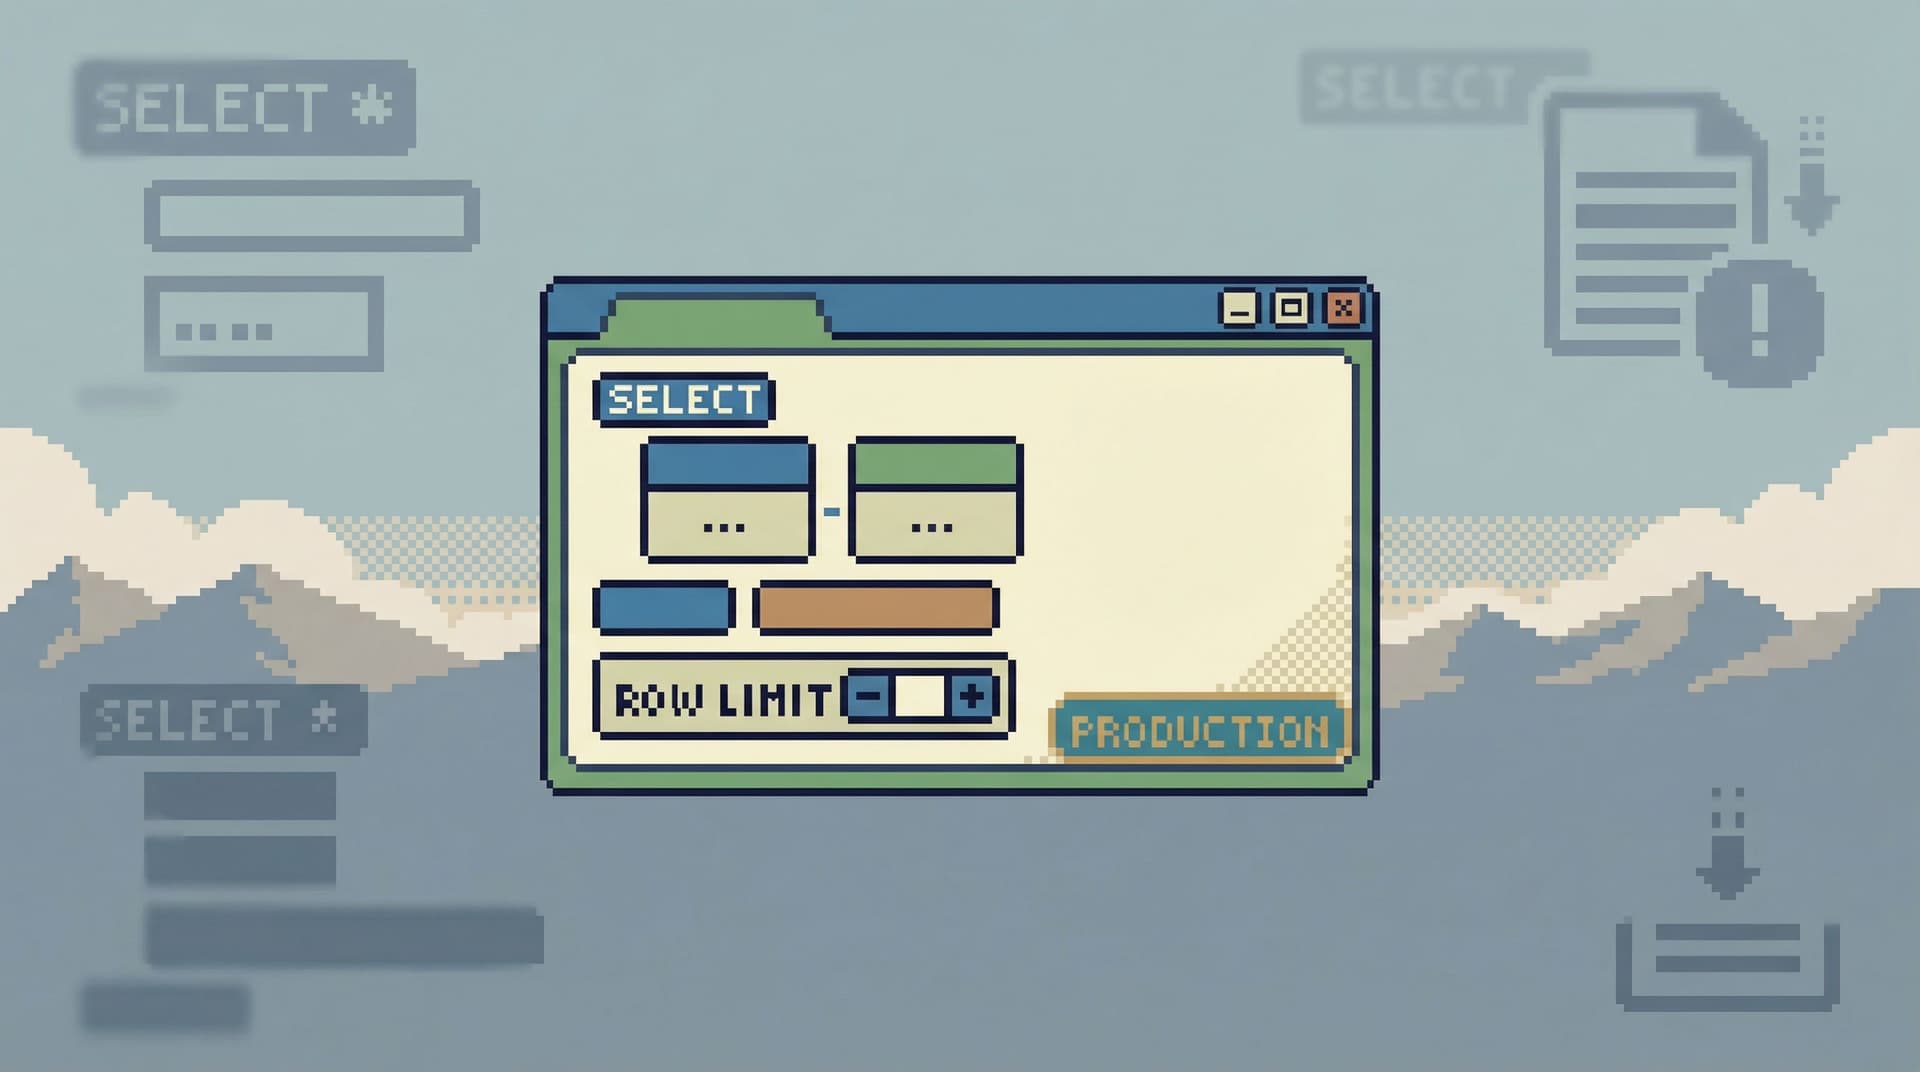
Pick one calm, read‑only database browser as the source of truth for production data during the incident.
If you’re using Simpl, that means:
- Connect to production in read‑only mode
- Treat that session as the place where database questions get answered
Everything else (local clients, ad‑hoc scripts) is parked.
Why this matters:
- You reduce risk: no surprise writes, no accidental schema changes.
- You reduce noise: everyone knows where to look for “what the data says.”
2. Start with a single anchor question
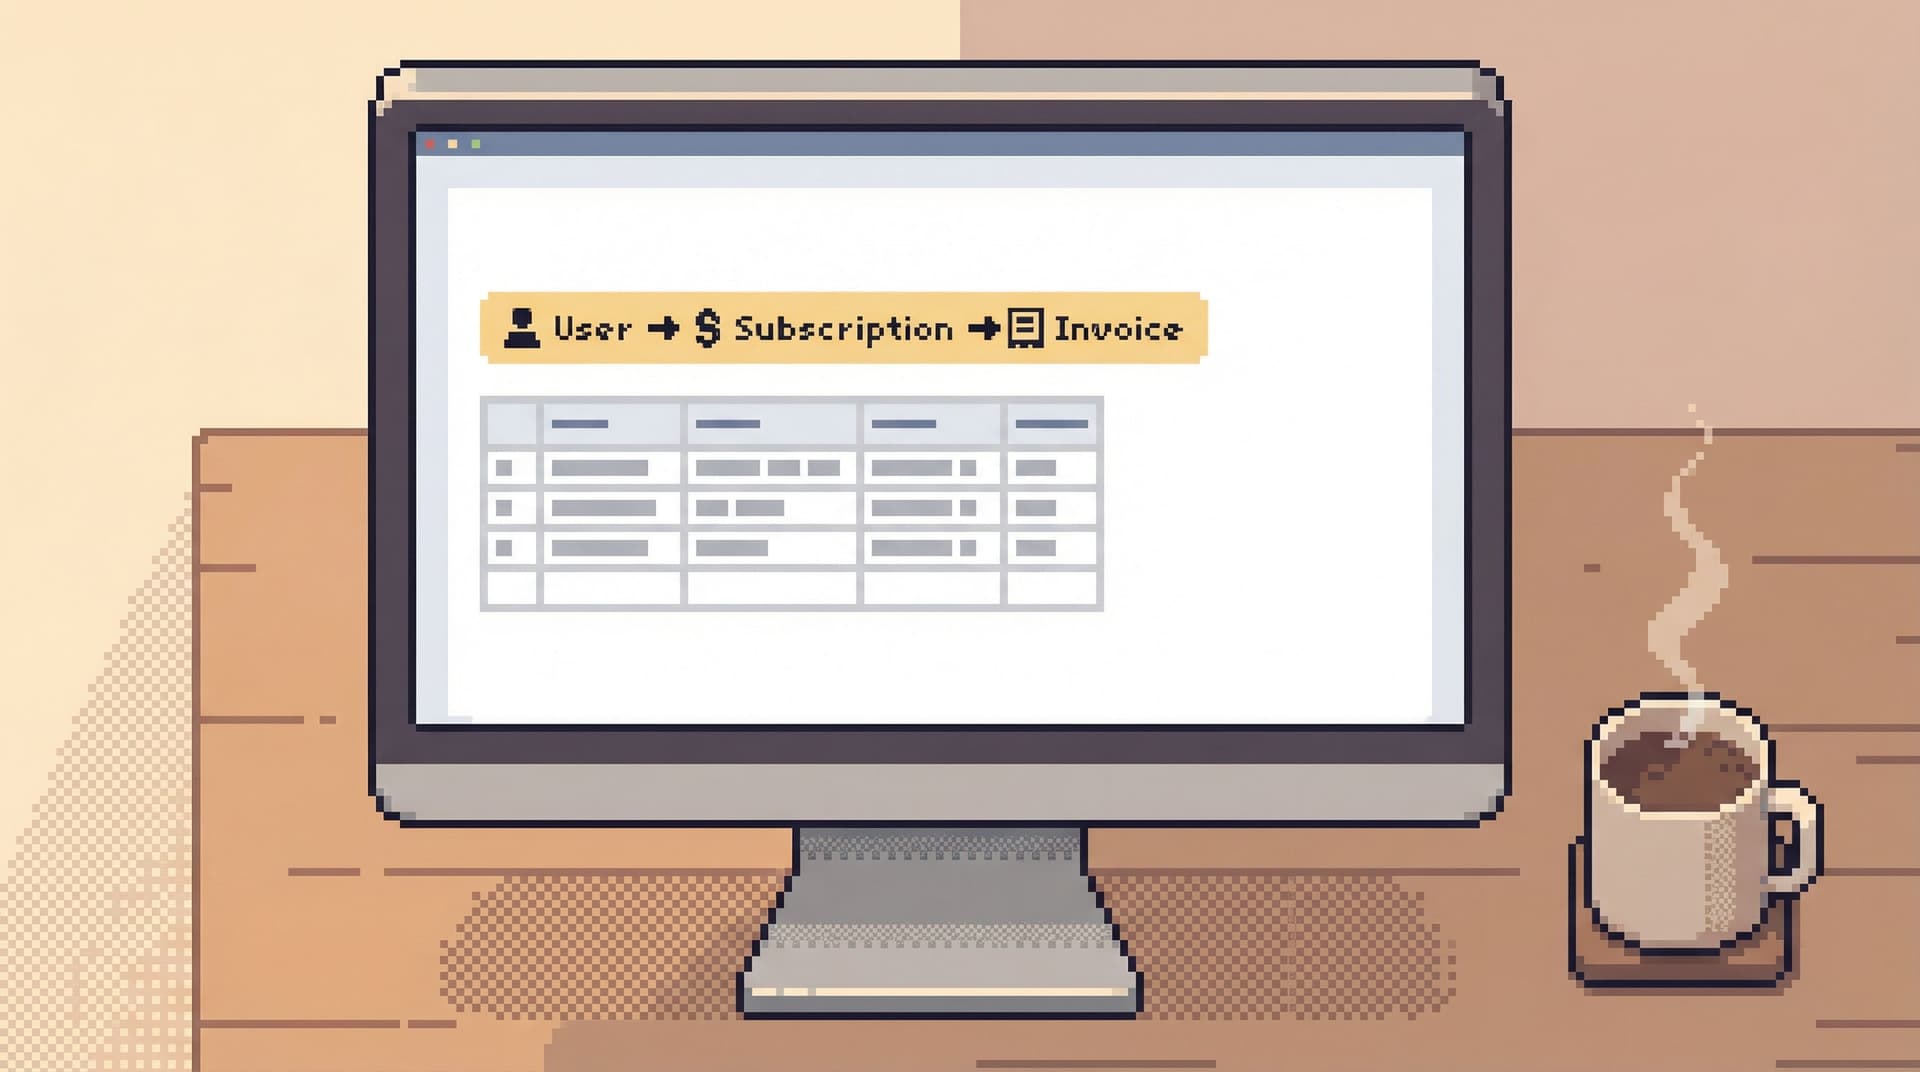
Every incident should start with one clear, data‑level question. For the subscription bug:
“Show the full lifecycle of subscription X around the time of the double charge.”
Your first query should:
- Be narrow (one user, one subscription, one job ID)
- Include timestamps and state transitions
- Be saved as the first step in the trail
In a tool like Simpl, that might mean:
- A focused view around the subscription entity
- A query that’s clearly labeled (“Baseline view of subscription 123 before/after incident”)
3. Move in deliberate, labeled steps
From that first anchor, each new query should be:
- A small refinement of the previous one
- Labeled in plain language: “Check related invoices for subscription 123”, “Check job runs for charge duplication”
- Saved as part of the same trail, not spun off into a new window
This gives you:
- A visible chain from symptom → hypotheses → evidence
- Less temptation to wander into unrelated tables or “while we’re here” queries
This is exactly the kind of linearity described in Production Reads Without the Rabbit Holes: Structuring Safe, Linear Debugging Sessions: one path, no side quests.
4. Keep the trail read‑only, even when you see the fix
At some point, you’ll see the bug:
- A flag that didn’t flip
- A job that retried incorrectly
- A race condition in how states are written
The temptation is to “just fix it” from the same surface.
Resist that.
Instead:
- Capture the exact rows and states that prove the bug
- Stop the read trail there
- Move to your normal, controlled write path (migrations, scripts, deploys) for the fix
The read trail remains a pure narrative of what happened, not a mix of investigation and remediation.
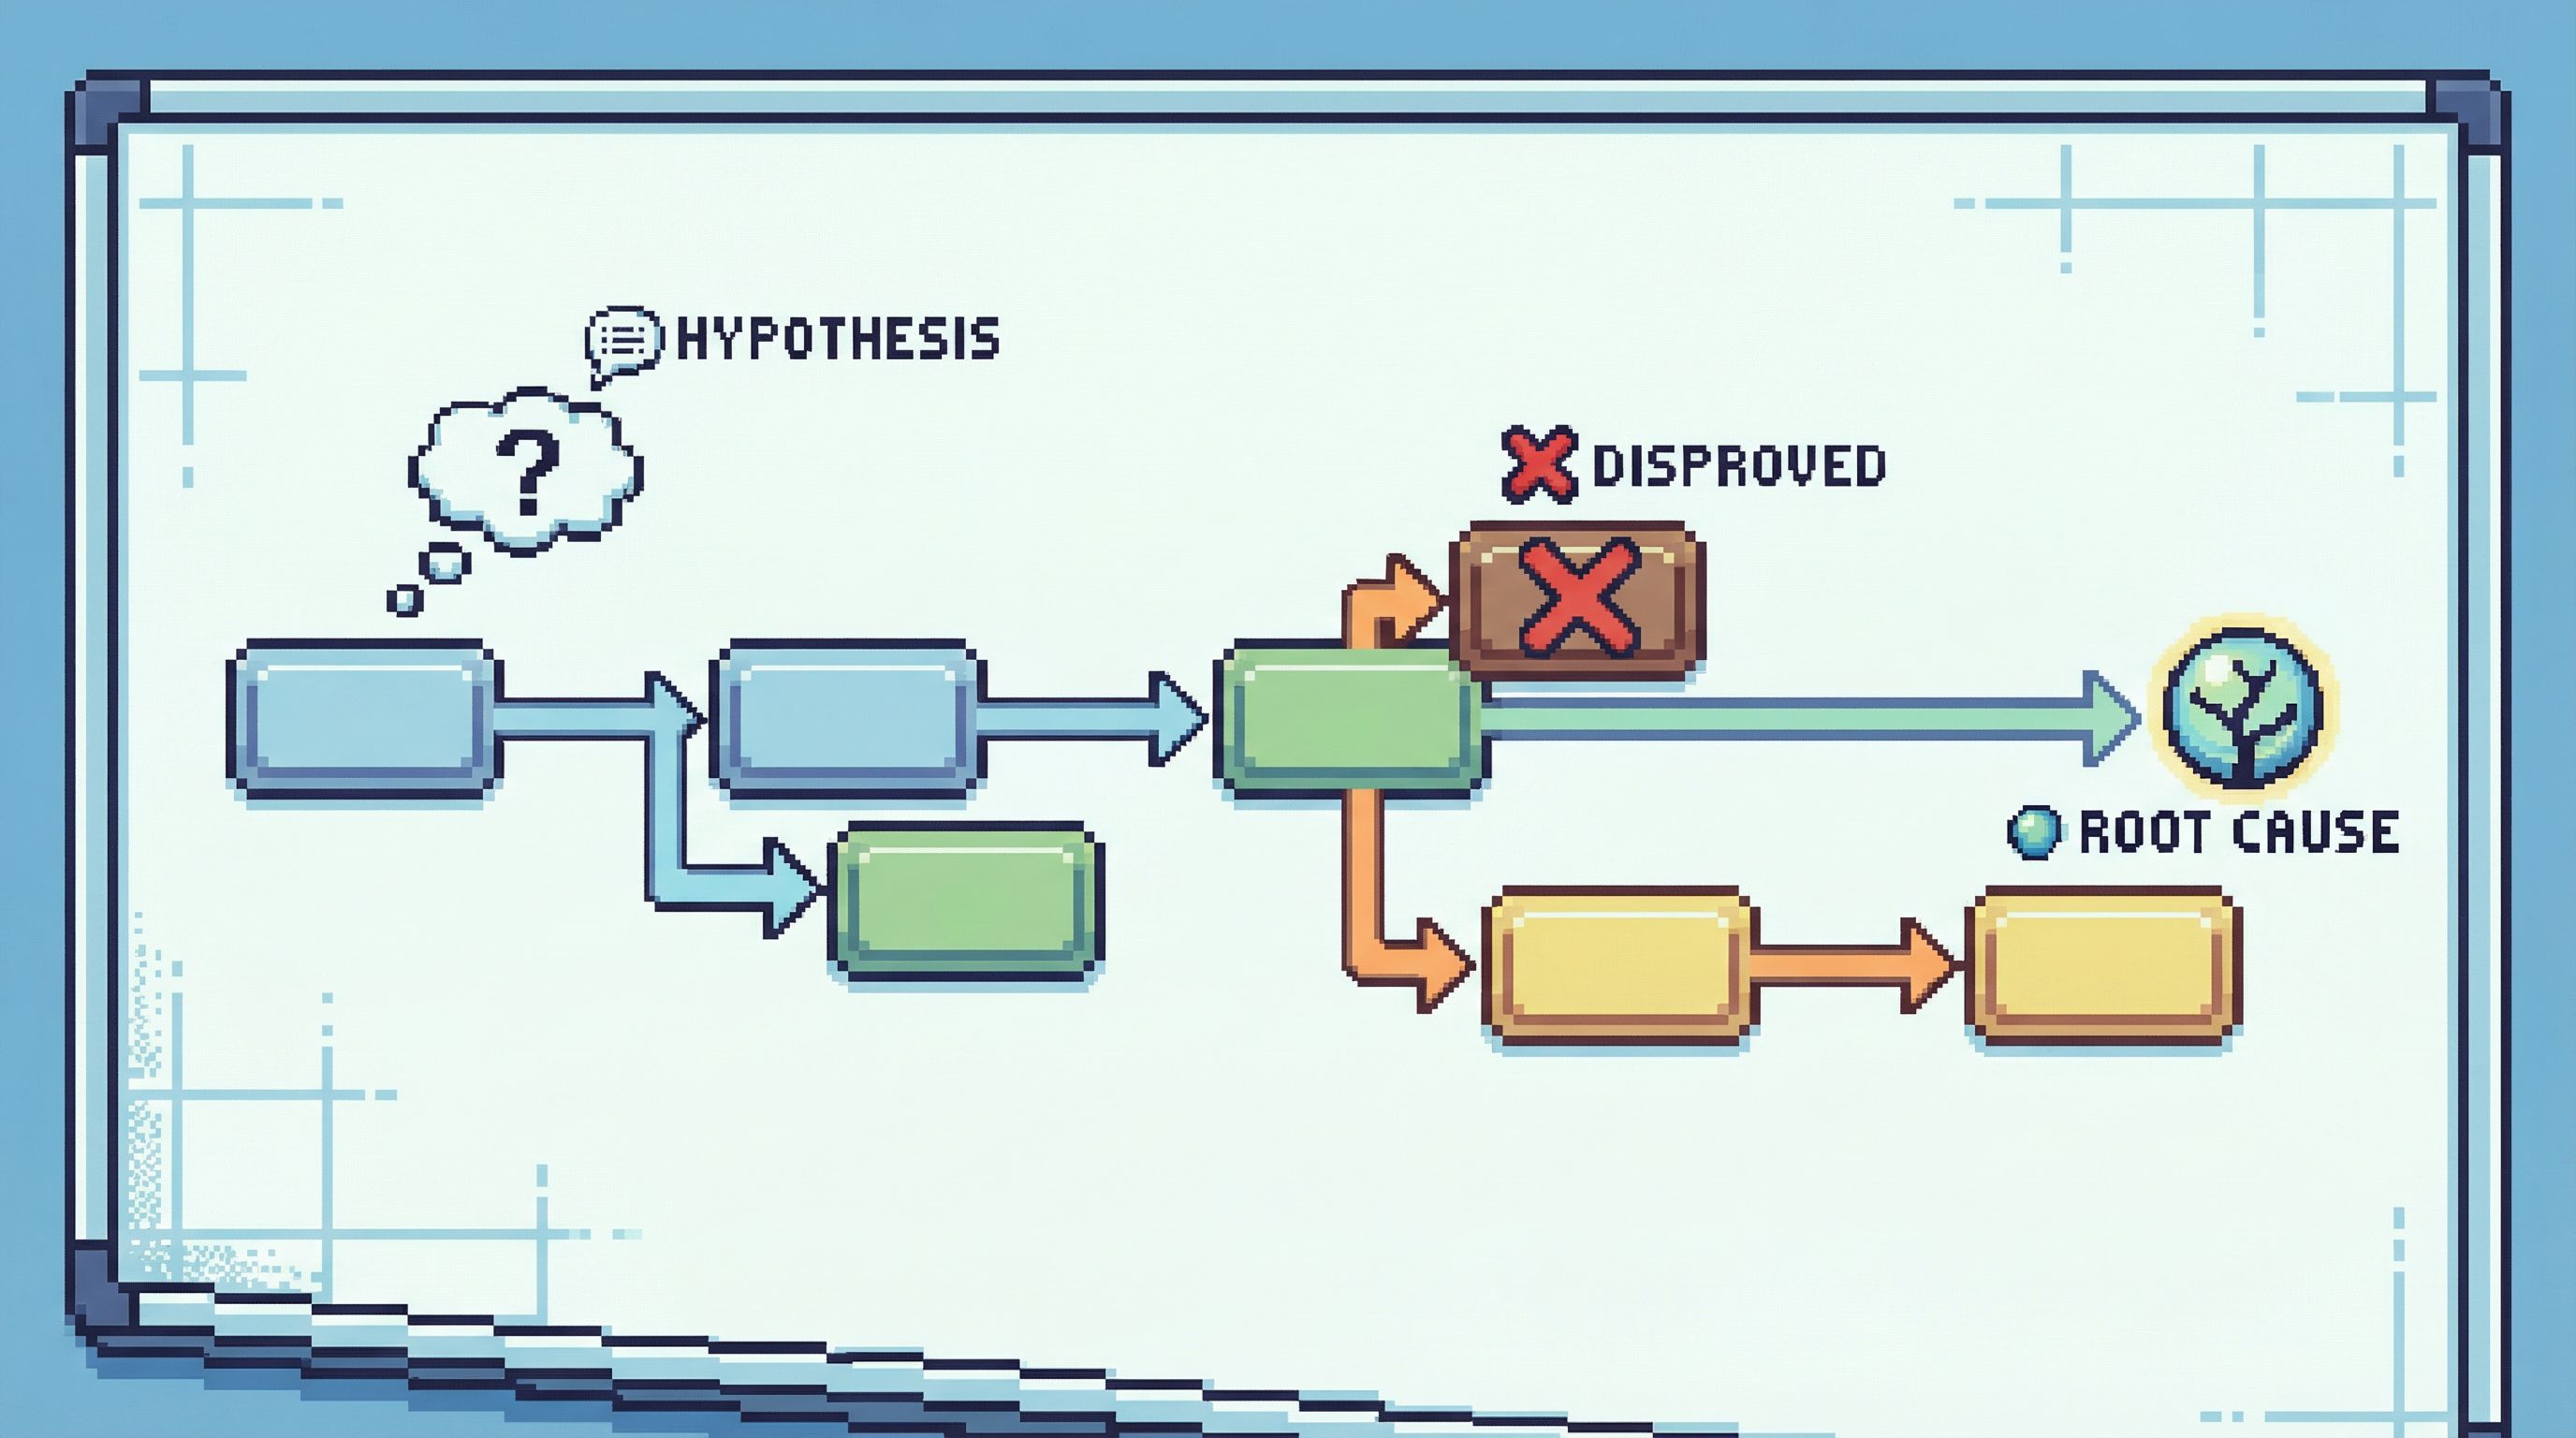
5. Annotate the key pivots
Not every query in the trail is equally important. During or right after the incident, mark the queries that:
- Changed your understanding
- Confirmed or disproved a hypothesis
- Revealed a surprising state or edge case
You don’t need paragraphs of commentary. A short note is enough:
- “Confirms double insert from job
charge_subscriptionat 12:03 and 12:04.” - “Shows subscription status flipped back to
trialingafter successful payment.”
These annotations are gold during the postmortem. They show not just what the data was, but how your thinking moved.
Designing the trail so postmortems write themselves
A good postmortem answers three data‑centric questions:
- What actually happened in the data, in order?
- What did we believe was happening at the time?
- What guardrails would have made this incident unlikely or boring?
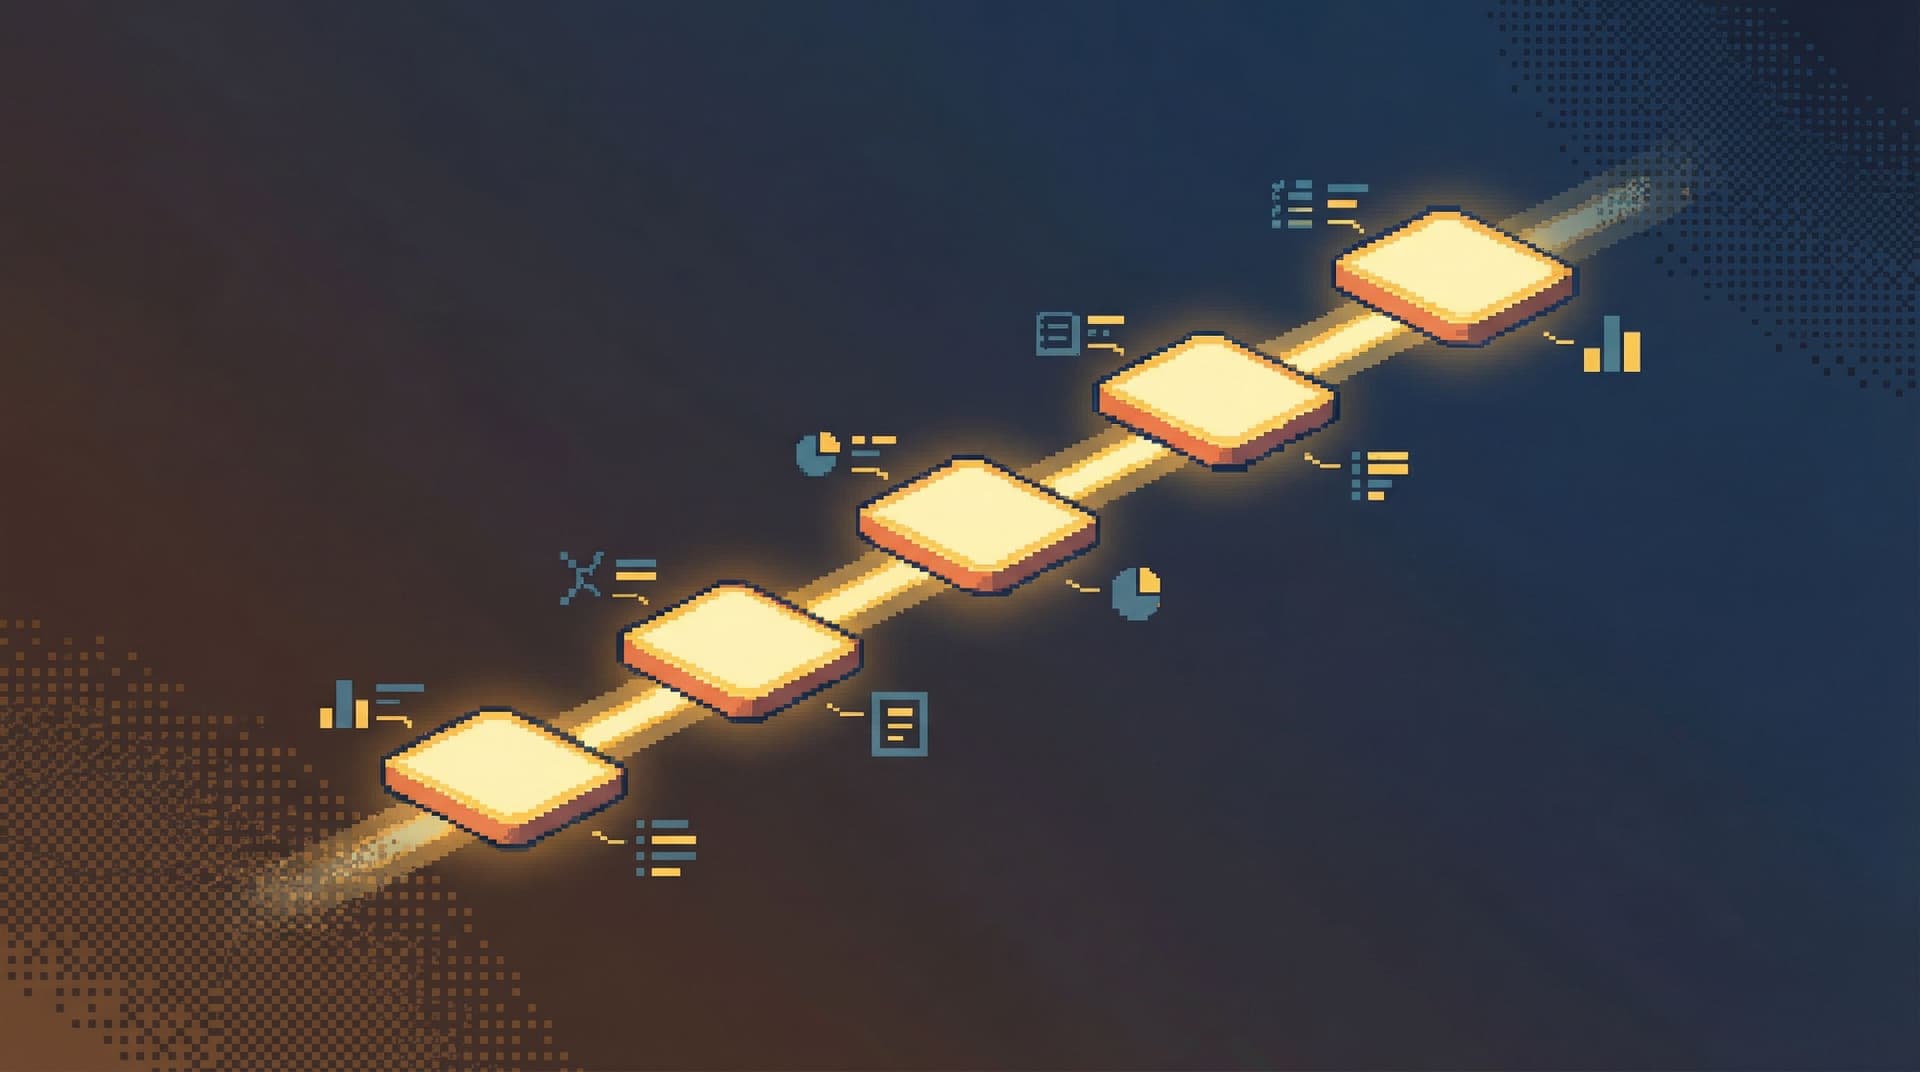
A single calm query trail can feed all three.
1. From trail to timeline
Your query trail is already time‑ordered. To build the postmortem timeline, you can:
- Pull the key queries (the annotated ones)
- For each, capture:
- The question it was answering
- The key rows or fields that mattered
- The conclusion: what you learned
This becomes the backbone of the “What happened?” section.
2. From trail to misaligned mental models
Any time you had to rewrite or significantly narrow a query, you probably had a wrong or incomplete mental model:
- You thought a table was small; it wasn’t
- You assumed a state was unique; it wasn’t
- You assumed a job was idempotent; it wasn’t
Those moments are visible in the trail:
- A wide query followed by a much narrower one
- A query that joins an unexpected table
- A filter added after seeing unexpected rows
Call these out in the postmortem:
- “We assumed
subscription_statewas authoritative; this query showed us invoices were the real source of truth.” - “We believed retries were capped at 1; this query showed multiple retries for the same idempotency key.”
Now your postmortem is not just a story of the incident, but a story of how your understanding changed.
3. From trail to future guardrails
The trail also shows where guardrails were missing. For example:
- A query that had to be manually filtered to avoid scanning a hot table
- A subtle join condition that was easy to get wrong
- A state transition that required multiple tables to interpret correctly
Each of these can turn into a concrete improvement:
- A narrower, pre‑built read path for common entities (user, subscription, job)
- Guardrails in the query editor that make wide reads harder, as described in Guardrails in the Query Editor: UX Patterns That Make Unsafe Reads Hard by Default
- A read‑only incident view that stitches together the key tables for a given ID
The postmortem then naturally ends with:
- “Here are the read paths we’ll add or tighten so the next person doesn’t have to reconstruct this by hand.”
Patterns that make read‑first incidents stick
You don’t need a brand‑new process document to make this work. You need a few simple patterns that become muscle memory.
Pattern 1: One primary query owner per incident
Even if multiple people are helping, designate one person as the query trail owner:
- They drive the database investigation
- Others suggest hypotheses and questions
- All queries that “count” go through the single trail
This prevents:
- Competing, unsynced investigations
- Conflicting screenshots and partial evidence
Pattern 2: IDs over dashboards
Dashboards are useful for detection. But once you’re inside the incident, switch to concrete IDs:
- User IDs
- Subscription IDs
- Job IDs
- Correlation IDs from logs
Every query in the trail should be anchored to one of these. It keeps the story grounded and makes replay trivial.
Pattern 3: Short, narrative labels
Don’t let queries live as raw SQL only. Give them titles that sound like questions or statements:
- “Baseline view of subscription 123 around incident window”
- “Check for duplicate invoices for subscription 123”
- “Verify retry behavior of job 9876”
Later, in the postmortem, you can almost copy these labels directly into the timeline.
Pattern 4: Separate “what happened” from “what we’ll change”
During the incident, the trail is about observation, not prescription.
- Capture the data
- Capture the order of discoveries
- Capture the moments of surprise
After the incident, in the postmortem, you can map these to changes:
- Safer defaults in your database browser (read‑only, narrower surfaces)
- Better entity‑centric views, as described in Schema Less, Context More: Designing Database Views Around Real Debugging Questions
- Stronger guardrails and pre‑built read paths
How tools like Simpl help
You can approximate a read‑first incident trail with any SQL client and a lot of discipline. But an opinionated tool like Simpl makes it the default, not a heroic effort.
A calm, read‑first browser can:
- Start in read‑only mode against production
- Encourage a single linear trail instead of tab explosions
- Make each query labelable and shareable as part of a narrative
- Provide entity‑centric views (user, subscription, job) so you’re not reinventing joins during every incident
Instead of exporting screenshots and snippets into a doc, your postmortem can link back to the trail itself: a live, replayable story of what you saw.
Summary
A read‑first incident is not a new ceremony. It’s a different stance:
- Read‑only by default. The incident database surface is for understanding, not fixing.
- One calm query trail. Every important database question flows through a single, linear path.
- Narrative, not noise. Queries are labeled, annotated, and saved as a story you can replay.
When you do this consistently, postmortems stop feeling like reconstructions and start feeling like replays. You’re not guessing what happened in the data. You’re walking back through the exact trail you followed under pressure.
Take the first step
You don’t need to redesign your entire incident process to get value from this.
For the next incident:
- Pick one read‑only database surface as the source of truth.
- Designate one person as the query trail owner.
- Label and save each query as part of a single, linear story.
If you want a tool that’s built around this way of working, try running your next incident through Simpl. Treat the database side of the incident as a calm, read‑first narrative—and let your postmortems grow naturally out of that single, clear trail.