From Dashboards to Direct Reads: When Engineers Should Skip the Chart and Open the Browser


Dashboards are good at telling you that something is wrong.
They are not always good at telling you what actually happened.
For that, you usually end up back where the story lives: rows in a database.
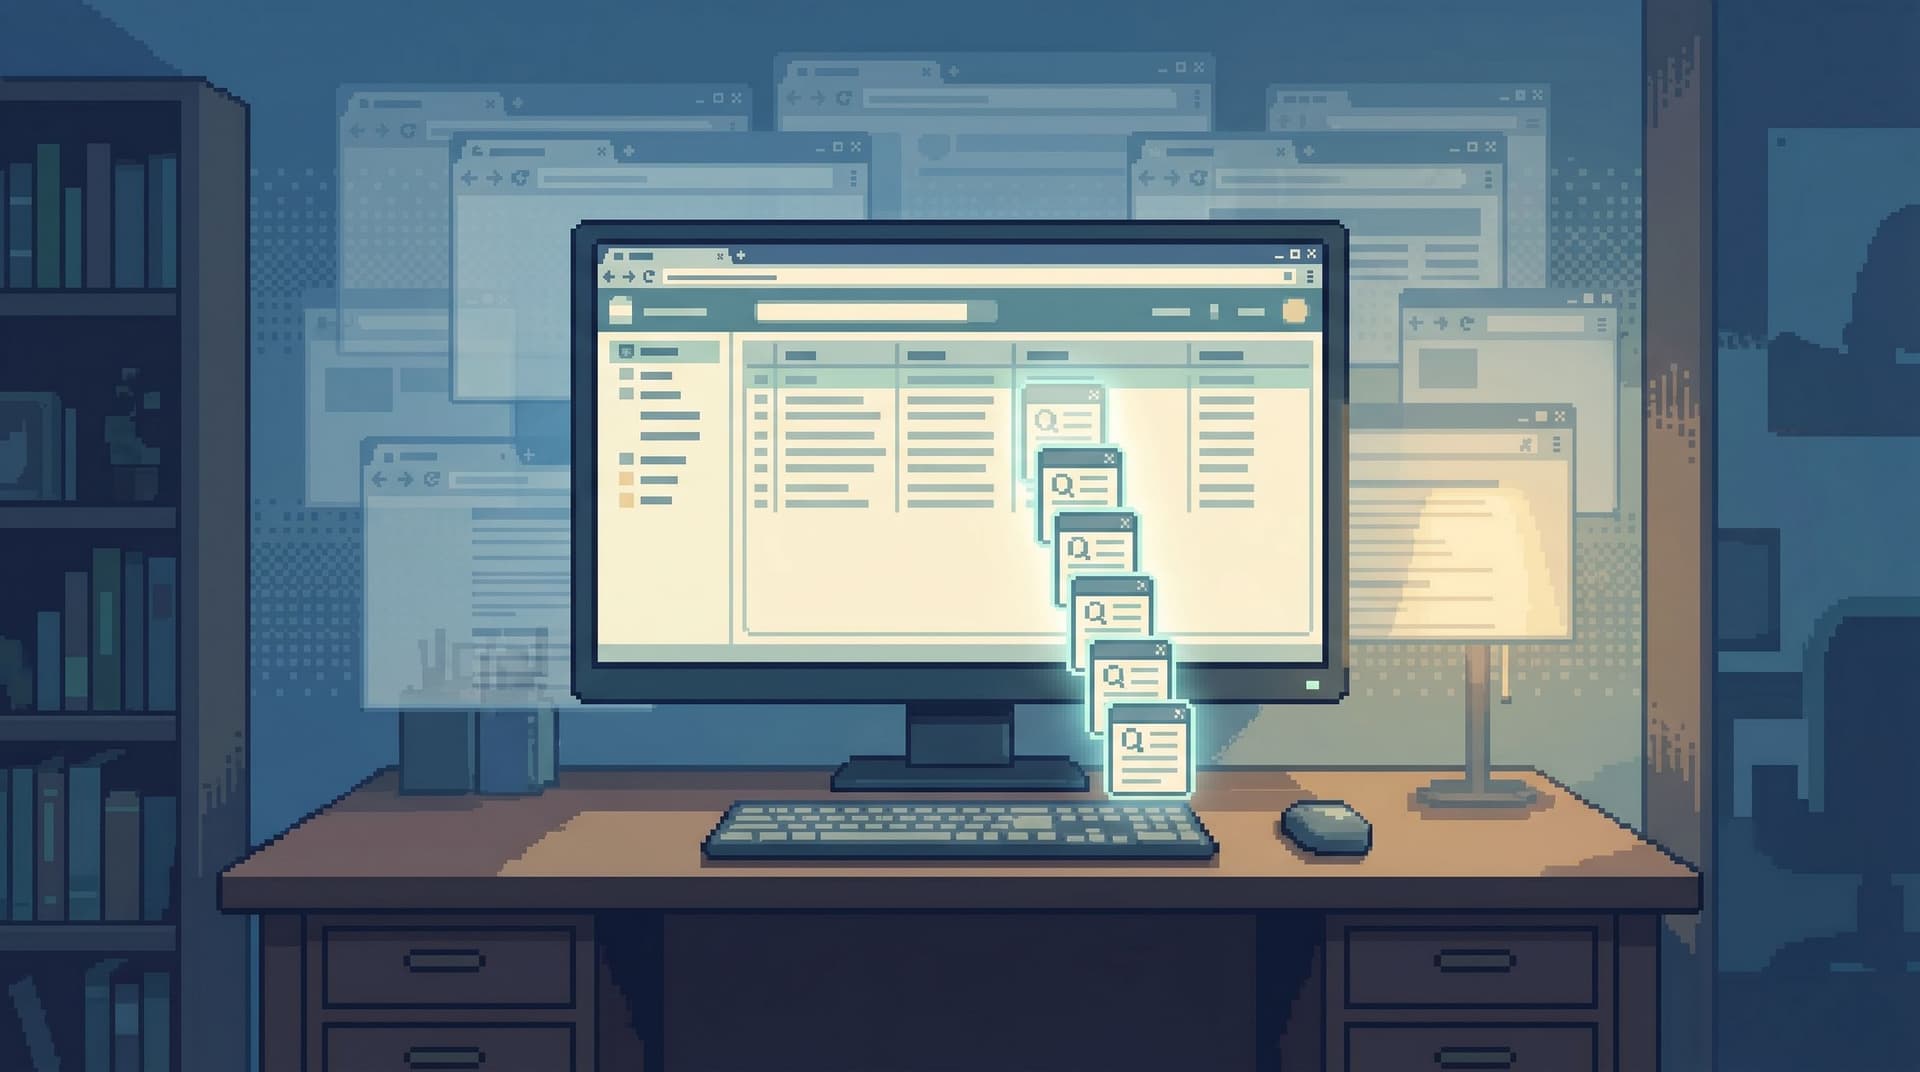
This post is about that moment. The point where another panel, another slice, another drill‑down won’t help—and the calmest next step is to stop staring at charts and open a database browser instead.
Tools like Simpl sit exactly in that gap: an opinionated database browser for focused reads, not a full BI suite or admin console. The goal isn’t more visibility. It’s clearer, quieter understanding.
Why this distinction matters
Most teams overuse dashboards because they’re visible, shared, and already there. Over time, that creates subtle costs:
- Incidents stretch while people hunt for "the right" dashboard.
- Debugging gets fuzzy because you’re reasoning from aggregates, not concrete rows.
- BI tools become overloaded—forced to serve as incident consoles, support tools, and ad‑hoc query pads.
Meanwhile, the questions you actually need to answer during real work are often painfully specific:
- “What happened to this user’s last three orders?”
- “Why did this payout get stuck yesterday but not today?”
- “Which tenants are on the new schema and seeing errors?”
Those are not chart questions. They are read questions.
Moving from dashboards to direct reads at the right time gives you:
- Faster clarity. You see the exact rows involved, not a summary.
- Less tool‑hopping. One browser, one path, instead of bouncing across dashboards, log viewers, and ad‑hoc SQL.
- Better trails. A direct read path can be replayed and shared, instead of a private click‑history across tiles.
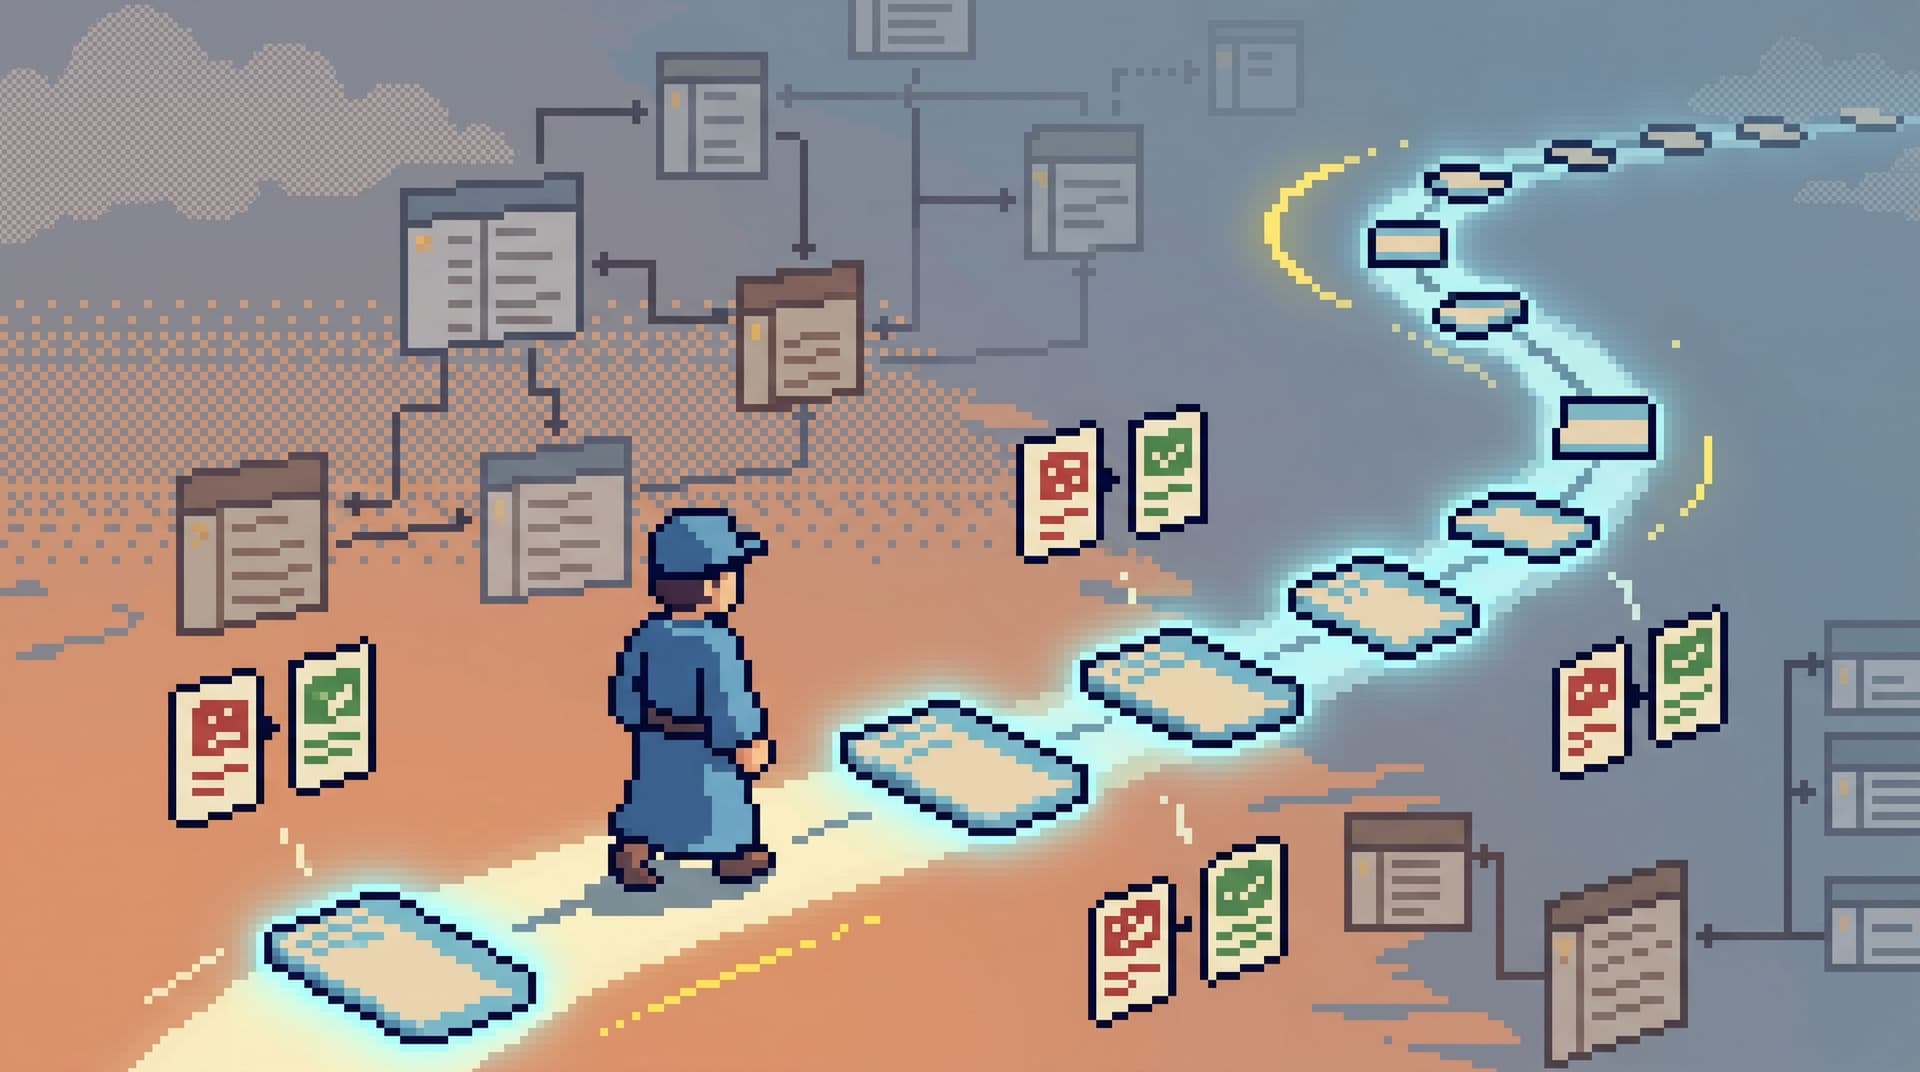
If this resonates, you may also find it helpful to think about incidents as trails, not tiles—something we unpack in detail in Post-Dashboard Debugging: Why Incident Workflows Need Trails, Not Tiles.
What dashboards are actually good at
Before we argue for direct reads, it’s worth being specific about where dashboards shine.
Dashboards are strong at:
- Detection. Error rates, latency, saturation, usage spikes.
- Trend and direction. Is this getting better or worse over the last hour/day/week?
- Shared awareness. Everyone can see the same red tile and agree something is off.
They are less strong at:
- Single‑entity stories. One user, one order, one payout.
- State transitions. What changed between two concrete points in time.
- Edge cases. The handful of rows that don’t match the pattern.
The failure mode is familiar: you see a red chart, you keep drilling, you keep slicing, and you never quite land on the actual rows where the story lives.
That’s the moment to stop.
When you should skip the chart and go straight to rows
Here are the patterns where engineers are usually better off opening a calm database browser like Simpl instead of reaching for another dashboard.
1. You’re debugging one user, not the system
If the question includes a specific identifier—user ID, order ID, tenant ID—you are already past what dashboards are good at.
Signals you should switch to direct reads:
- A support ticket with a concrete ID attached.
- A bug report that includes a specific timestamp and user.
- A product manager asking about “this one account” or “this one invoice.”
Why a browser beats a chart here:
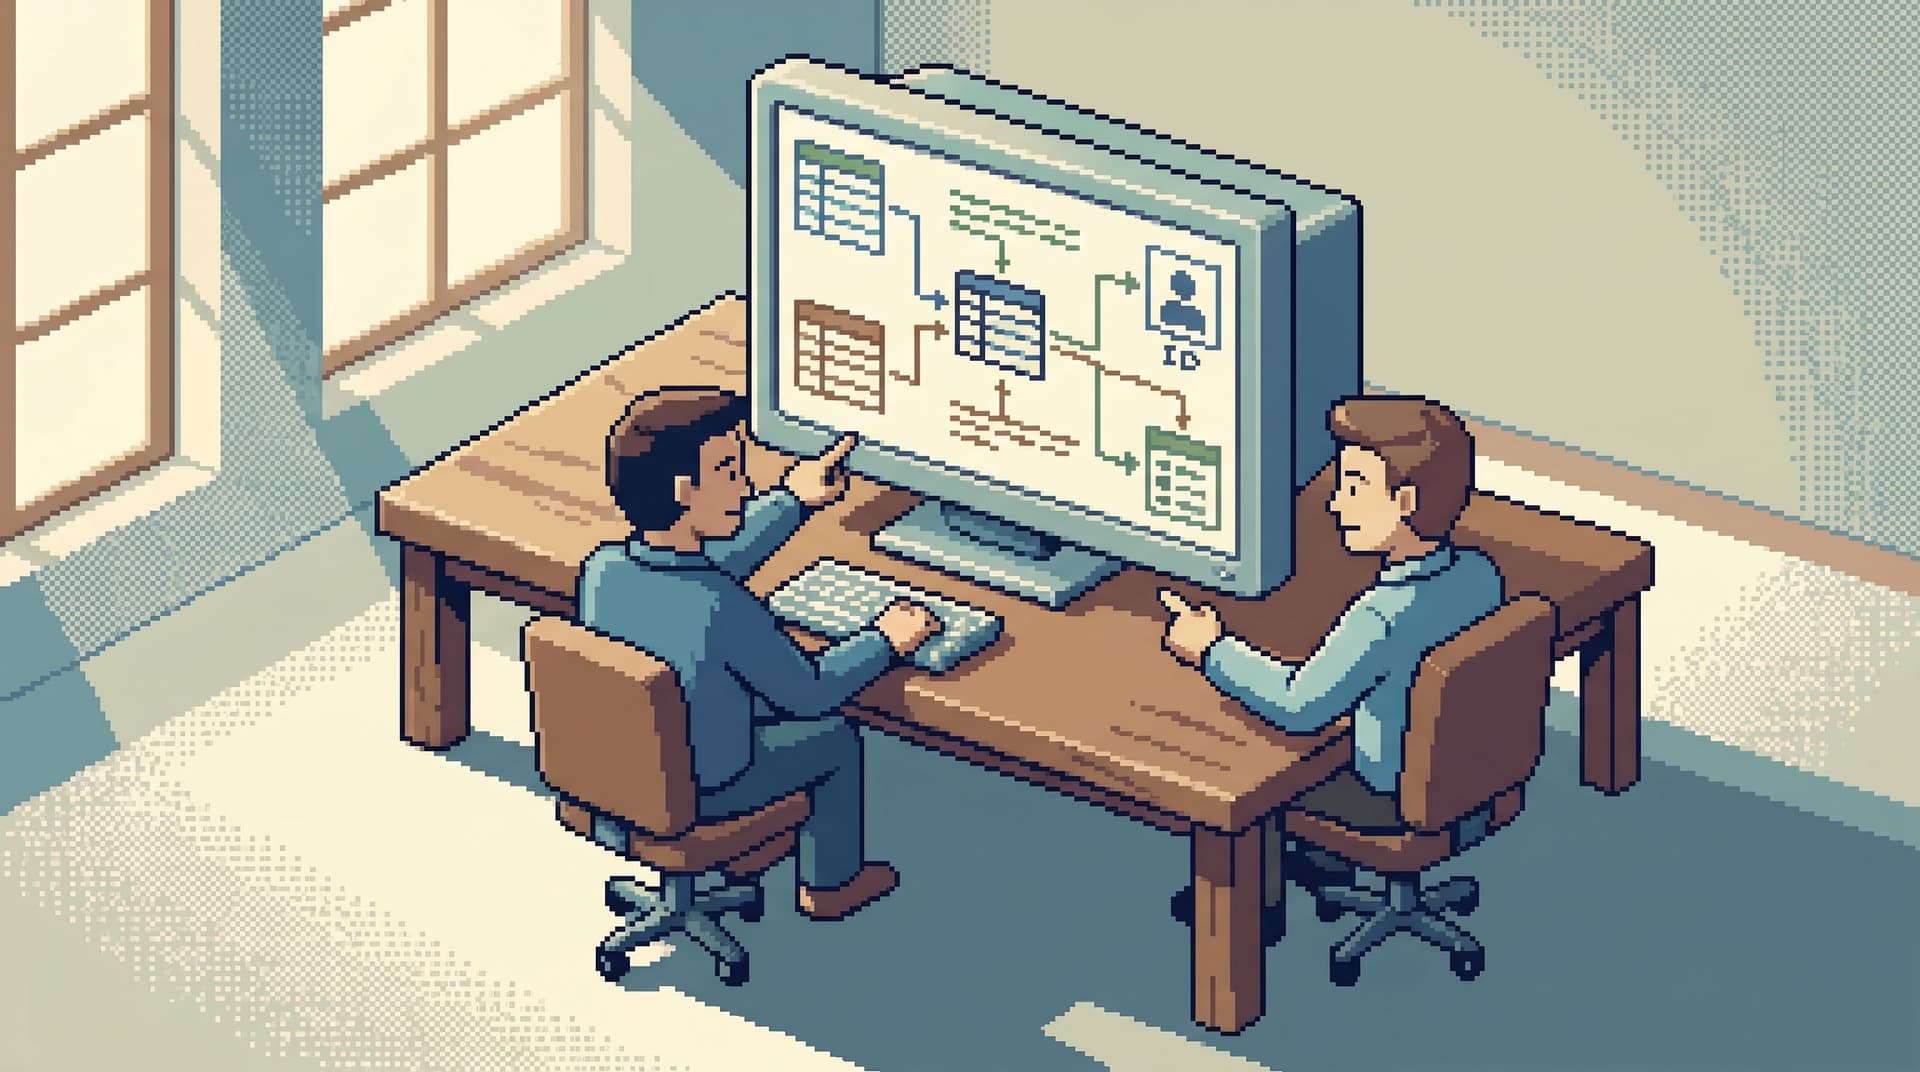
- You can follow the user’s story across tables: users → orders → payments → notifications.
- You can see exact field values, not bucketed metrics.
- You can verify edge cases (flags, feature versions, migration states) that rarely show up cleanly in charts.
If you want a deeper walkthrough of this pattern, see Focused Reads in a Microservice World: Following One User Across Many Databases Without Getting Lost.
2. You suspect a schema or configuration change
Dashboards tell you that something changed. They rarely tell you what changed.
Signals you should switch:
- A deploy just landed.
- A migration recently ran.
- Only some tenants or regions are affected.
Why a browser helps:
- You can inspect actual schema state: columns, defaults, nullability, constraints.
- You can compare before/after values for a small set of rows.
- You can see feature flags, configuration rows, and version markers in one place.
This is the territory of schema drift and quiet migrations—exactly the kind of work explored in The No-Map Migration: Browsing Schema Changes Without Losing Your Debugging Flow.
3. You need to compare two concrete states
Charts are about ranges. Many incidents are about two points:
- “Before we flipped the flag” vs “after we flipped the flag”.
- “Yesterday for this user” vs “today for this user”.
- “Staging right now” vs “production right now”.
Signals you should switch:
- You find yourself opening multiple dashboards for different time windows.
- You’re exporting CSVs just to do manual comparisons.
- You’re recreating the same filters in three different tools.
Why a browser helps:
- You can run two focused queries side‑by‑side.
- You can filter down to the same entity (user, order, tenant) in both states.
- You can diff values at the row level instead of eyeballing overlapping charts.
A calm browser like Simpl can turn this into a repeatable pattern: saved read paths for “before/after deploy,” “yesterday vs today,” or “staging vs prod,” so you don’t reinvent the comparison every time.
4. You need a trail, not just an answer
Dashboards are transient. You click around, you learn something, and then it disappears into muscle memory.
For incidents and recurring debug flows, that’s a problem.
Signals you should switch:
- You’re pasting screenshots of dashboards into Slack to explain what you saw.
- New teammates can’t easily replay how you reached a conclusion.
- Every incident feels like a fresh scavenger hunt.
Why a browser helps:
- A focused browser session can be shared and replayed.
- Queries and filters live as part of the trail, not as one‑off console history.
- You can turn a good investigation into a reusable read path or template.
This is the core idea behind both Less Tabs, More Trails: Structuring Long Debugging Sessions as One Continuous Read Path and The Post-Query Culture: How Teams Turn One-Off Debug Sessions into Shared Calm Data Practices: your best reads shouldn’t vanish after the incident.

How to move from dashboards to direct reads without chaos
Switching tools mid‑incident can feel risky. The key is to make the move deliberate, not reactive.
Here’s a simple pattern you can adopt as a team.
Step 1: Decide your “dashboard exit criteria”
Make it explicit when you stop pulling new charts and start reading rows.
Examples of exit criteria:
- Entity identified. As soon as you have a concrete ID (user, order, tenant), you move to a browser.
- Two failed slices. After two rounds of slicing a dashboard without new insight, you switch tools.
- Schema suspicion. Any time a migration, feature flag, or config change is in play, you go straight to rows.
Write these down. Put them in your incident runbooks. The point is to avoid the quiet trap of “one more chart.”
Step 2: Choose one primary browser
Fragmented entry points are their own form of noise:
- A SQL IDE.
- A BI “explore” mode.
- An admin console.
- A raw psql session on a jump box.
Pick one calm, read‑first entry point—something like Simpl—and treat it as the place where direct reads happen.
What this gives you:
- Shared muscle memory. Everyone knows where to go when dashboards stop helping.
- Safer defaults. You can design guardrails once (read‑only, scoped access, safe filters) instead of managing them across five tools.
- Better trails. Queries, filters, and flows accumulate in one place.
For a deeper dive into why a single entry point matters, see The Calm Query Session: Designing Database Work Around One Entry Point, Not Ten.
Step 3: Standardize a few core read paths
Don’t start from a blank editor every time. Identify your recurring questions and turn them into opinionated paths.
Common examples:
- User journey read. Given a user ID, show identity, recent sessions, orders, payments, and notifications.
- Order health read. Given an order ID, show status transitions, payment attempts, refunds, and shipment events.
- Tenant rollout read. Given a tenant ID, show feature flags, schema versions, and error hot spots.
In a browser like Simpl, these can live as saved flows or templates: pre‑scoped queries with sensible filters, parameterized by the IDs you care about.
You’re not building a full internal tool. You’re encoding the way you already debug, so the next person doesn’t have to re‑invent it from scratch.
Step 4: Keep the surface area small
Direct reads are powerful. They should still feel safe.
A few practical constraints:
- Read‑only by default. No write queries in the same interface where most people debug.
- Scoped access. Structure roles around real read work (support, SRE, product engineering), not job titles.
- Guardrails in the UX. Opinionated limits on unfiltered full‑table scans, pagination defaults, and environment selection.
If you want to go deeper here, The Calm Guardrail Catalog: Small UX Constraints That Make Production Reads Feel Safe is a good companion read.
A concrete incident example
Let’s walk through a simplified flow.
A payment error rate chart goes red.
1. Detection (dashboard)
- An alert fires from your metrics system.
- A dashboard shows payment failures spiking for the last 15 minutes.
- You confirm it’s real, not a fluke.
2. Exit criteria hit
- You pull one more slice: failures by payment provider.
- You see the spike is mostly for one provider and one region.
- A support ticket arrives with a specific order ID that failed.
- You now have a concrete entity. Time to leave the dashboard.
3. Direct read (browser)
You open Simpl as your primary browser.
- Use a saved "Order health" read path.
- Plug in the failing order ID.
- See:
- Order status:
payment_failed. - Payment attempts: three retries, all with the same error code.
- Feature flags: this tenant is on a new retry policy.
- Timestamps: the failures started immediately after the new policy rolled out.
- Order status:
You pivot to the tenant rollout read path:
- Confirm this tenant is on the new policy.
- Check a control tenant on the old policy—no spike.
4. Decision
- You now have a grounded story: a new retry policy is causing repeated failures with one provider.
- You roll back the policy for affected tenants.
- You leave behind a clear trail: the exact read paths and queries used.
Notice what didn’t happen:
- You didn’t open five extra dashboards.
- You didn’t export CSVs.
- You didn’t drop into a raw SQL console under pressure.
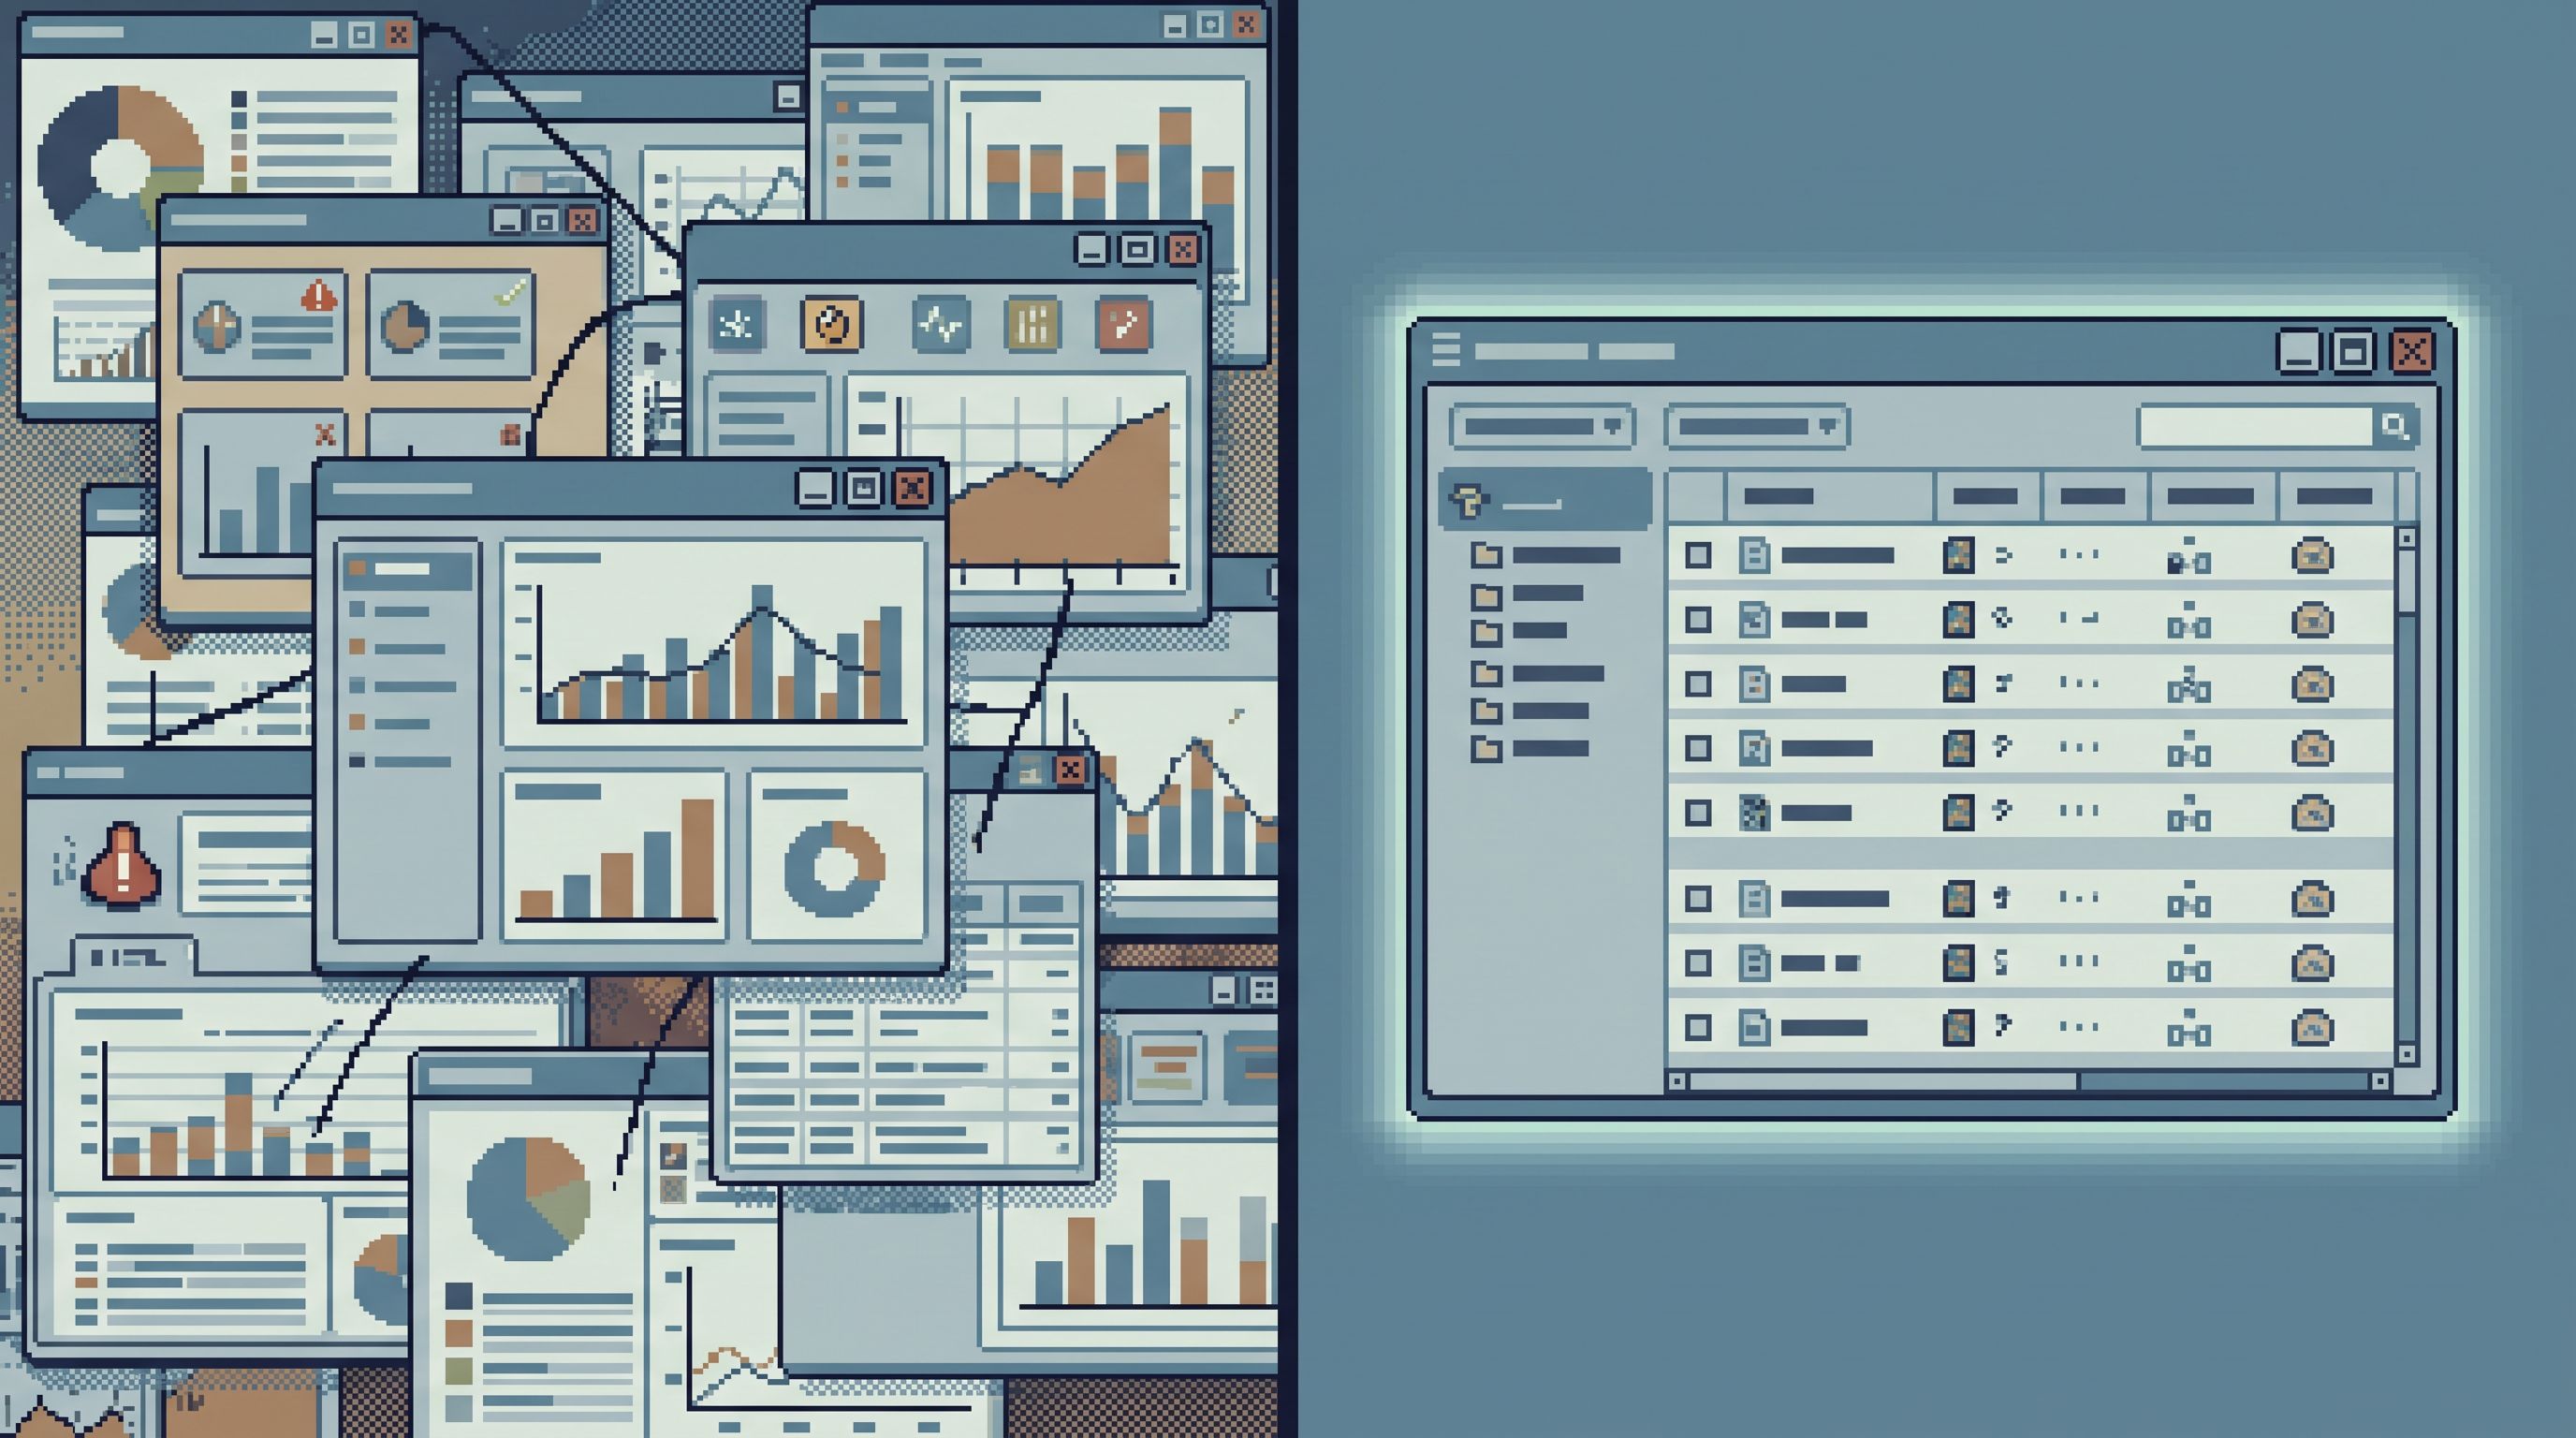
You moved from tiles to trails, then from trails to code.
Making this the default, not the exception
The long‑term win is cultural: treating dashboards as the start of the investigation, and direct reads as a normal, safe, shared next step.
A few ways to normalize that:
- Name the pattern. In incident reviews, call out where you should have switched to direct reads earlier.
- Capture trails. When someone runs a particularly clear investigation, turn it into a saved read path or template.
- Reduce entry points. Gradually retire ad‑hoc consoles and scattered tools in favor of one opinionated browser.
- Teach by pairing. During incidents, have someone drive the browser while others narrate what they’re looking for.
Over time, you’ll feel the shift:
- Fewer screenshots of dashboards in Slack.
- More links to concrete read sessions.
- Less anxiety about “touching prod,” because the read surface is constrained and predictable.
This is the same quiet posture described in The Anti-Tab Debug Session: Running an Entire Incident from One Browser Window: one primary tool, one coherent trail, less noise.
Summary
- Dashboards are for detection and direction. They tell you something is wrong and roughly where.
- Direct reads are for stories and decisions. They show you the exact rows involved in a bug, migration, or support ticket.
- You should switch earlier than you think. As soon as you have a concrete ID, a suspected schema change, or the need to compare two precise states, it’s time to open the browser.
- One calm browser beats many scattered tools. A focused, read‑only interface like Simpl lets you design guardrails once, share trails, and standardize core read paths.
- Make it a habit, not a hero move. Define exit criteria from dashboards, encode recurring reads as templates, and treat trails as shared assets.
Take the first step
You don’t need to redesign your entire observability stack.
Pick one concrete change:
- Choose a single database browser to be your primary read entry point.
- Define one or two "dashboard exit" rules for your next incident.
- Turn your most common debug question into a saved read path.
Then, the next time a chart goes red, resist the urge to open three more dashboards.
Open the browser instead.
Let the rows tell you what actually happened.