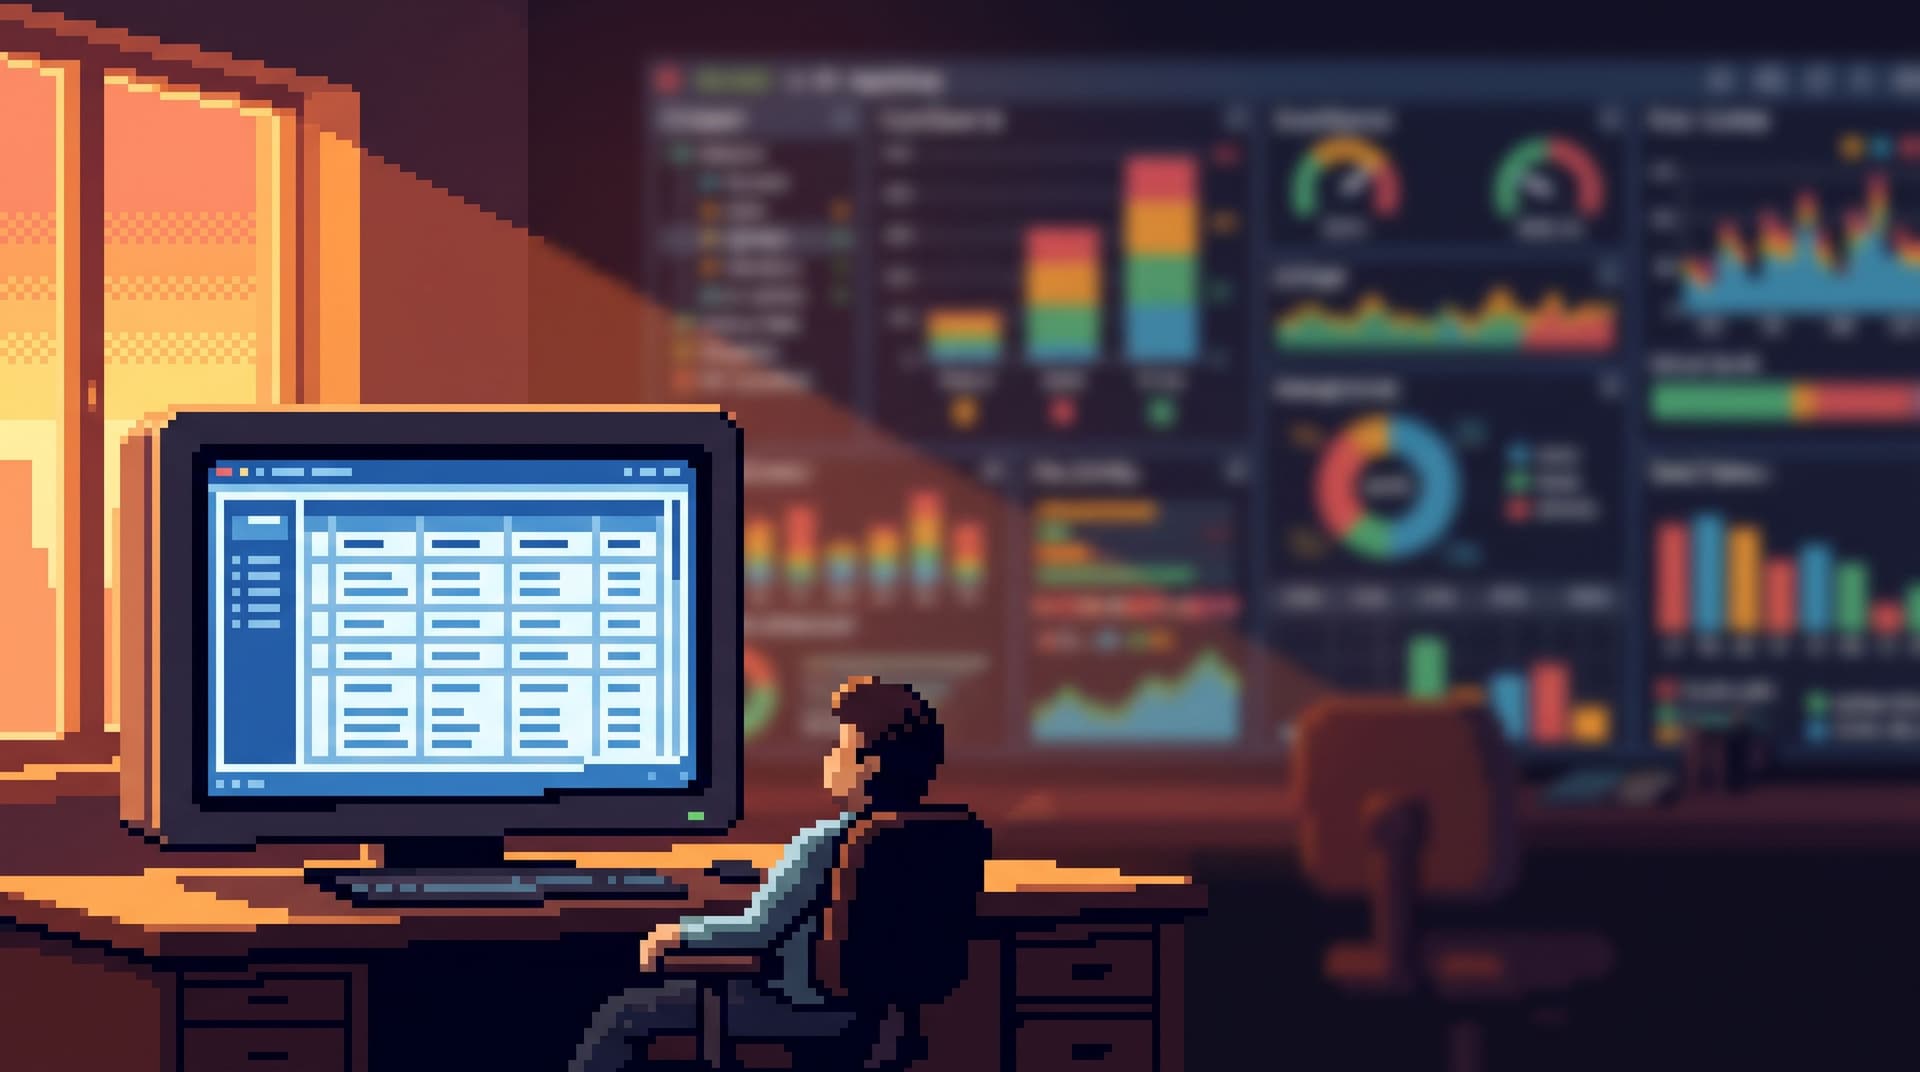
The Single-Row Debug: Solving Incidents by Fully Understanding One Record

Most incidents end on a single row.
Not a dashboard. Not a log line. Not a graph of error rates.
They end when someone can point at one concrete record and say:
“This user, with this ID, hit this code path at this time. Here’s exactly what the data looked like before, during, and after.”
That’s the single-row debug.
It’s a posture, not a trick. A way of treating one record as the primary lens for understanding an incident, and letting everything else orbit around it.
Tools like Simpl exist for this posture: an opinionated database browser that keeps you anchored to a small set of meaningful rows instead of wandering through endless tables.
Why one row is often enough
Most production bugs are local.
They show up as:
- One user whose invoice is wrong
- One job that never finished
- One subscription that got stuck
- One payment that retried forever
You might see them first as aggregates — a spike in failures, a drop in conversions — but the explanation lives in specific records.
Focusing on a single row matters because it:
- Reduces cognitive load – You’re not juggling five dashboards and three partial theories. You’re reading one story.
- Keeps the scope safe – A read-only, row-first posture is naturally less risky than wide, exploratory queries.
- Improves team alignment – Everyone can literally look at the same record and talk about the same facts.
- Produces better artifacts – A clear narrative about “this row, this timeline” is easier to share, review, and reuse.
If you’ve read Post-Dashboard On‑Call: Running Incidents From Rows, Not Charts, this is the same idea at a tighter scale: not “rows in general,” but one row in particular.
What a single-row debug actually looks like
Single-row debugging is not “click around until you find something weird.” It’s a structured way to move from signal to row to explanation.
At a high level, it looks like this:
- Start from a concrete identifier (user ID, job ID, order ID, trace ID).
- Anchor on the primary row that represents the thing that’s broken.
- Reconstruct the row’s timeline across related tables and events.
- Check expectations vs reality column by column.
- Capture the story so it can be reused and shared.
Let’s walk through each step more concretely.
Step 1: Start from a concrete identifier
The single-row debug starts with a name.
That name might be:
- A user ID from a support ticket
- An order ID from a payment provider
- A job ID from a background worker
- A session or trace ID from your logs
The important thing: you pick one. You’re not “looking at signups”; you’re looking at user_id = 12345.
Practical tips:
- Normalize how IDs show up in tools. If your logs, alerts, and application UIs all surface the same IDs, it’s much easier to jump into a database browser like Simpl and land on the right row.
- Prefer durable identifiers. Email addresses and usernames change. Primary keys don’t. Train support and on‑call to always include canonical IDs in tickets and alerts.
- Avoid multi-tenant ambiguity. If you’re multi-tenant, make sure your “one row” is scoped:
tenant_id + user_id, not justuser_id.
Once you have the identifier, your first move should be to:
- Open your database browser
- Navigate directly to the relevant table
- Filter down to exactly one row
If your tool makes this hard — if you find yourself scrolling, guessing, or typing full SQL just to land on a record — you’re already paying a tax. This is part of why we wrote The Anti-Feed Database: Escaping Infinite Scroll Patterns in Developer Data Tools: you want a jump, not a feed.
Step 2: Anchor on the primary row
With the identifier in hand, your next job is to find the canonical representation of the thing you care about.
Examples:
- For a user: the main
userstable, not a denormalized analytics view - For an invoice: the
invoicestable, not a derived “invoice summary” table - For a job: the
jobsortaskstable, not an aggregated status table
You’re looking for the row that:
- Is authoritative for the domain concept
- Is write-backed by your application (not just a view)
- Has stable keys used across the rest of the system
Once you’re there, pause. Don’t click away yet.
Read the row like a story:
- What are the key status columns? (
state,status,is_active, etc.) - What are the timestamps that matter? (
created_at,updated_at,processed_at) - What are the foreign keys that point to related entities? (
plan_id,organization_id,payment_method_id)
A calm browser like Simpl should make this feel like reading a well-structured card, not a wall of raw cells.
Opinionated constraints help here:
- Grouping related columns together
- De‑emphasizing noisy metadata
- Highlighting state and timeline fields
Your goal in this step is simple: understand what this row claims about reality, right now.
Step 3: Reconstruct the row’s timeline
Incidents are rarely about a row’s current state alone. They’re about how it changed over time.
The single-row debug continues by following that row’s story through related tables:
- Events and logs – What events reference this row’s ID?
- State transitions – How did the status change, and when?
- Downstream effects – What other rows were created or updated as a result?
This is where a lot of teams fall into data wandering: clicking around unrelated tables, re-running similar queries, and losing the thread. We wrote about this pattern in From Data Wandering to Data Walkthroughs: Structuring Calm Narratives for Debug Sessions.
To keep it linear, apply a few constraints:
- Follow keys, not guesses. Only jump to tables that are directly referenced by foreign keys or event payloads containing the same ID.
- Sort everything by time. When you open a related table, always sort by the timestamp that best represents “when this happened.”
- Stay within one “hop” at a time. From
users→subscriptionsis one hop. Fromusers→subscriptions→invoicesis two. Don’t jump three or four hops out unless the story demands it.
A good database browser will:
- Let you click foreign keys to open related rows in a focused way
- Keep a short, linear trail of where you’ve been, instead of a forest of tabs
- Make it easy to move back and forth in time for the same row
This is exactly the kind of work Simpl is built around: calm navigation over a few meaningful rows, not endless exploration.
Step 4: Compare expectations to reality, column by column
Once you have the row and its timeline, the next step is to ask: what did we expect to see here?
For each important column, you’re comparing:
- Expected value – based on product behavior, business rules, or code
- Actual value – what the row and related tables show
Some examples:
- A “canceled” subscription that still has
is_active = true - An invoice marked
paidwith no matching payment record - A job in
failedstate withretry_count = 0 - A
processed_attimestamp earlier thancreated_at
To make this comparison calm and reliable:
- Name the invariants. Say them out loud or write them down: “If
status = 'paid', then there must be at least one successful charge.” - Trace each invariant across tables. Use the row’s keys to find the related rows that should satisfy the rule.
- Mark what’s violated. When something doesn’t line up, note exactly which invariant failed.
This is where a lot of value hides in seemingly boring columns:
- Flags (
is_active,is_deleted,is_test) - Counters (
attempt_count,retry_count) - Timestamps (
canceled_at,completed_at,last_synced_at)
Opinionated tools can help by:
- Highlighting changes between two snapshots of the same row
- Showing related events alongside row state
- Making it easy to annotate or bookmark a “before/after” pair
You’re not just reading data; you’re validating a mental model of how the system should behave.
Step 5: Capture the story as a reusable artifact
The single-row debug is only fully done when the story is:
- Readable – someone else can follow it without you present
- Repeatable – you can re-run the same views if the bug reappears
- Shareable – support, product, and on‑call can all see the same thing
Instead of leaving the story in Slack scrollback or someone’s memory, capture it as a small, structured narrative:
- The question – “Why did user 12345 get double-charged on July 20?”
- The anchor row –
users.id = 12345andinvoices.id = 98765 - The timeline – a short list of key events and state changes with timestamps
- The invariants – what you expected vs what you saw
- The conclusion – the specific mismatch that explains the incident
You don’t need a heavy runbook system for this. A lightweight pattern is enough:
- A shared document or ticket template for “single-row debug stories”
- Links or saved views in your database browser pointing at the exact rows
- Screenshots only when necessary; prefer live, re-runnable queries or views
If your browser supports saved, read-only views (something Simpl leans into), you can:
- Save the filtered view for the anchor row
- Save the related views (events, jobs, payments) scoped by the same IDs
- Attach those links to your incident ticket or postmortem
Over time, these stories become a quiet library of debug narratives — a pattern we explored in From Noise to Narrative: Turning Raw Production Reads into Lightweight Debug Stories.
Designing your tools around single-row debugging
You can practice single-row debugging in almost any stack, but some tool choices make it dramatically calmer.
Here are a few opinionated constraints worth adopting.
1. A dedicated, read-focused browser
Don’t run single-row debugs from the same surface you use for schema changes or heavy experimentation.
You want a browser that:
- Defaults to safe, read-only access
- Makes it easy to land on one row quickly
- Encourages narrow filters over wide scans
This is the separation we argue for in The Minimalist Data IDE: Where Simpl Ends and Your Editor Should Begin. A tool like Simpl should be the calm place you read production, not the playground where you experiment.
2. Intentional navigation, not infinite scroll
Single-row debugging collapses if your main move is “scroll until something looks interesting.”
Instead, prefer:
- Direct jumps by ID
- Foreign-key-based navigation
- Cursor-based pagination that keeps you anchored around the row’s timeline
This is the anti-feed posture: move with intent, not with Next/Previous.
3. Clear, minimal session state
You don’t need ten tabs to debug one row.
A calmer pattern:
- One primary view for the anchor row
- One or two auxiliary views for related tables
- A short, visible trail of where you’ve been
If your browser treats every click as a new tab, you’ll end up managing the tool instead of the story. We dug into this in Database Work Without Tabs: Rethinking ‘Session State’ in Modern Data Tools.
4. Guardrails for production reads
Even in read-only mode, you can still hurt performance with wide, unbounded queries.
Design your tools so that:
- Filters are required on hot tables
SELECT *on huge tables is discouraged or shaped- Time-bounded reads are the default
A browser like Simpl can bake these constraints into the UI so that the path of least resistance looks a lot like a single-row debug.
Making single-row debug a team habit
A technique only matters if people actually use it under pressure.
To make single-row debugging part of your team’s muscle memory:
- Teach it explicitly. Walk new hires through real incidents where a single row told the whole story.
- Bake it into on-call checklists. “What’s the anchor row?” should be one of the first questions.
- Review incidents through this lens. In postmortems, ask: “Which row explained this? How quickly did we find it?”
- Align your tools. Make sure your logging, alerting, and application UIs all surface stable IDs that map cleanly into your database browser.
Over time, you’ll notice a shift:
- Fewer war-room style incidents
- More quiet, linear debug sessions
- Better shared understanding of how your system actually behaves
The work doesn’t feel smaller. It just feels clearer.
Summary
The single-row debug is a calm way to solve incidents:
- Start from a concrete identifier
- Anchor on the canonical row that represents the thing that’s broken
- Reconstruct the timeline of that row across related tables
- Compare expectations vs reality column by column
- Capture the story as a reusable artifact
With the right constraints — a read-focused browser like Simpl, intentional navigation, minimal session state, and safe defaults for reads — this becomes a natural way to work, not a special technique.
Most incidents already end with someone explaining a specific row.
The single-row debug just gets you there faster, with less noise.
Take the first step
You don’t need to redesign your entire stack to benefit from this.
Pick one upcoming incident review, or one tricky support ticket, and run it as a deliberate single-row debug:
- Identify the anchor row.
- Walk its timeline.
- Write down the story.
- Save the views you used in your database browser.
Then, look at your tools and ask:
- Did they make this path obvious, or did you fight them?
- Would a calmer, opinionated browser like Simpl make this easier next time?
Start small. One row, one story, one quieter incident.
That’s enough to begin.