The Single-Query Incident Review: Replaying Outages from One Calm Data Trail

Most incident reviews fail quietly.
Not because the team doesn’t care, or because the data isn’t there, but because the story of the outage is scattered across:
- Ad‑hoc queries in personal SQL clients
- Screenshots in Slack
- Dashboard links without filters
- Log searches no one saved
By the time you sit down for the review, you’re not replaying the incident. You’re reconstructing it from memory.
There’s a calmer way to work: treat each incident as a single query trail you can replay later.
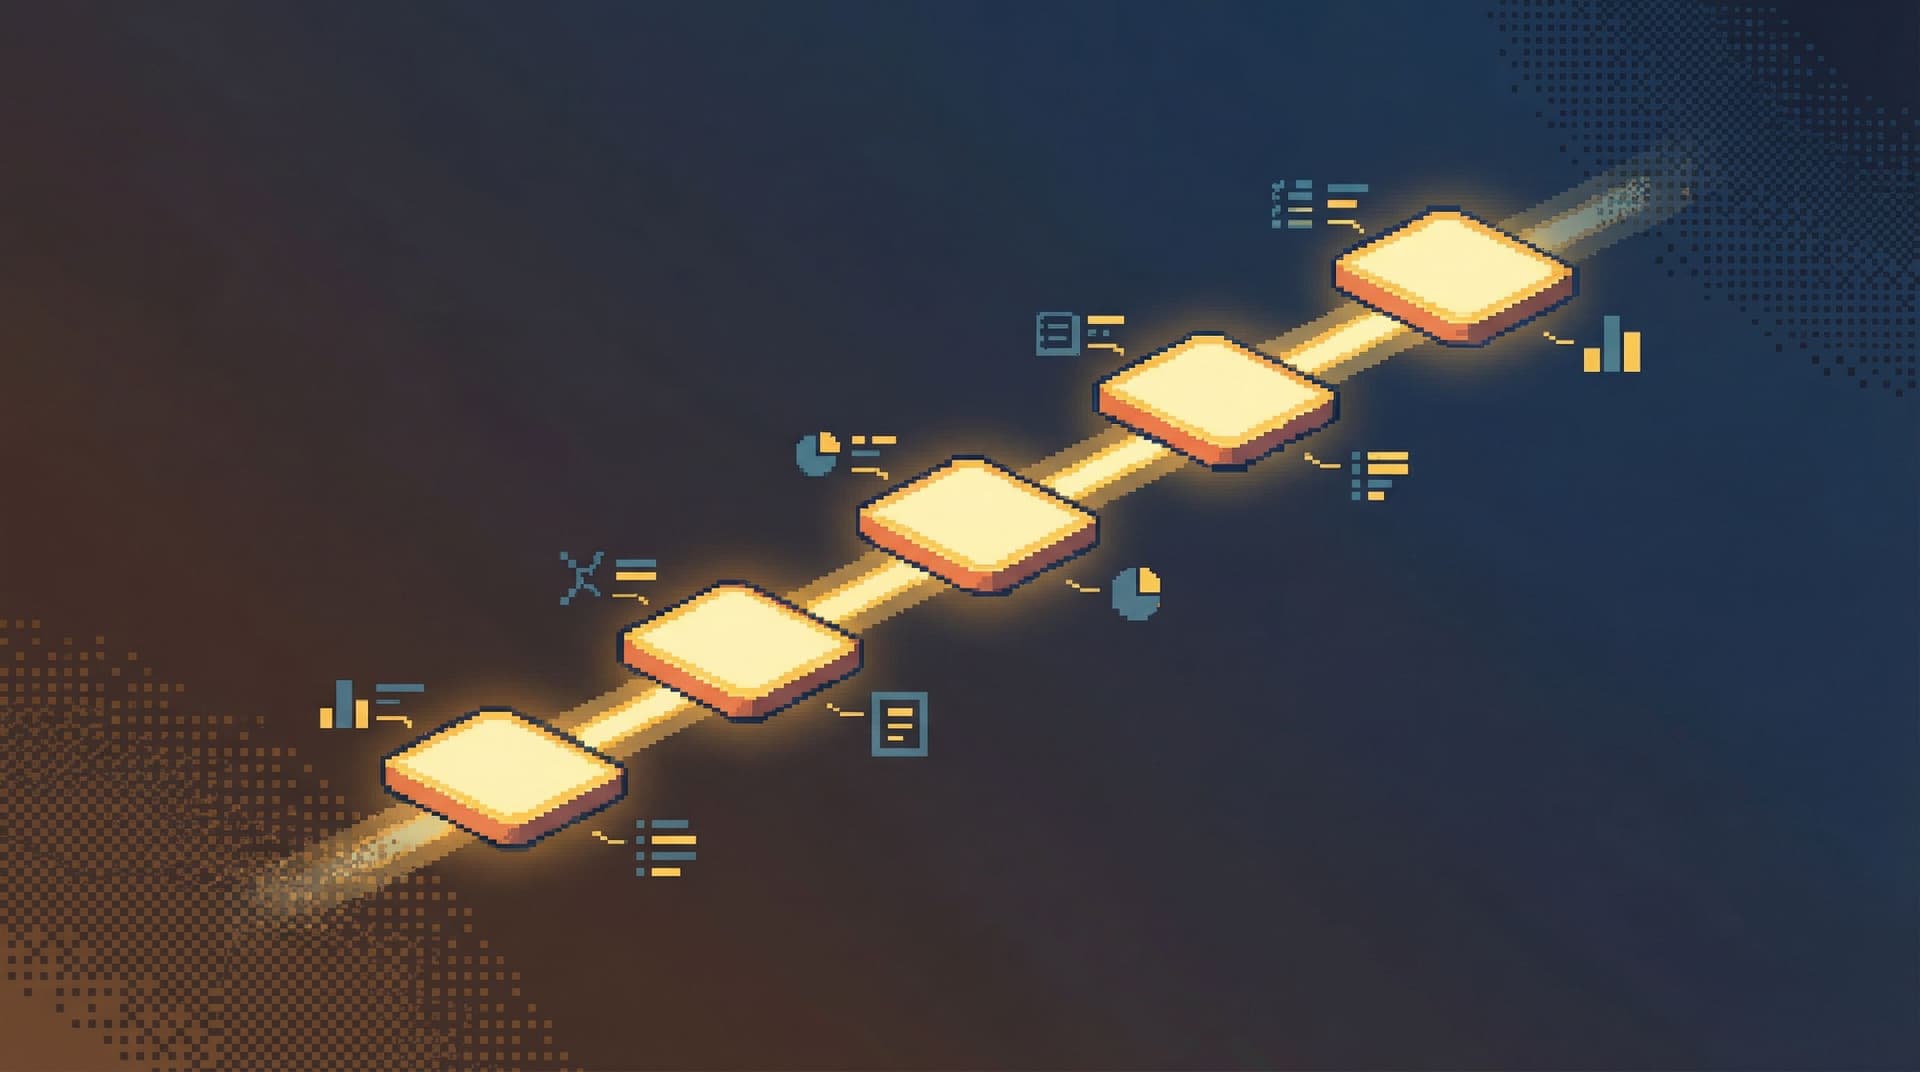
A single-query incident review is exactly that: one linear path of reads through your production data that explains what happened, when, and why. Not a maze of tools and tabs. One calm trail.
Tools like Simpl are built around this stance: opinionated, read-first database browsing that turns incident work into something you can replay, not just survive.
Why a Single Query Trail Matters
When an outage hits, your team is already under load. The interface and workflow shouldn’t add more.
Most teams feel the pain in a few specific ways:
- Context loss. Nobody remembers exactly which query finally convinced them the system was unhealthy.
- Inconsistent stories. Different people saw different slices of the data, in different tools.
- Unreproducible insight. You can’t easily re-run the exact same sequence of queries a week later.
- No real audit trail. You know someone queried production, but not what they looked at or in what order.
A single, linear query trail flips that:
- The story is the trail. Each query is a frame in the incident movie.
- Replays are trivial. You can re-run the exact path for a dry-run review, training, or regression check.
- Accountability is built in. You see who asked what, and when.
- Postmortems get calmer. You’re reading from a script, not improvising from vibes.
If this feels adjacent to the “read-first incident” idea, that’s deliberate. A lot of this thinking builds on the pattern of running postmortems from a single calm query trail, which we explored in more depth in The Read-First Incident: Running Postmortems from a Single Calm Query Trail.
What “Single-Query Incident Review” Actually Means
It’s easy to misread this as: “We only ever use one query during an incident.” That’s not the point.
Single-query here means:
- One active question at a time
- One linear sequence of queries answering that question
- One canonical trail you keep and replay
You might run 10, 30, 50 queries during an incident. That’s fine. The key is that they form a coherent, ordered narrative, not a pile of unrelated fragments.
Concretely, a good single-query trail has:
- A clear starting point. The first query that touches production in response to the incident.
- A bounded scope. Queries stay close to the incident story—no wandering into unrelated exploration.
- Minimal branching. You avoid three parallel “maybe” paths; you pick one, annotate the dead ends, and move on.
- Captured parameters. Timestamps, user IDs, job IDs, feature flags—everything that anchors the incident in data.
- A saved representation. Not just screenshots, but a replayable artifact in your database browser.
This mindset pairs naturally with the one-query mindset—structuring database work to avoid cognitive thrash. If you haven’t read it, The One-Query Mindset: Structuring Database Work to Avoid Cognitive Thrash is a good companion.
How Teams Usually Replay Incidents (And Why It Hurts)
Before we talk about the calmer version, it helps to name the default patterns.
1. The Screenshot Postmortem
- People paste query results into Slack during the incident.
- Nobody saves the actual queries.
- The postmortem doc ends up full of pasted images and “I think this is when we realized…”
Problems:
- No reproducibility
- No way to validate assumptions later
- No sense of sequence—just disjoint snapshots
2. The Dashboard Maze
- The team jumps between multiple dashboards in tools like Looker, Grafana, or Datadog.
- Each person tweaks filters locally.
- The final story is “we looked at a bunch of graphs and decided X.”
Problems:
- Hard to see the exact filters and time windows used
- Dashboard panels weren’t designed for this specific incident
- You still end up dropping into raw data later
We talked more about this split between reporting and exploration in From BI Sprawl to Focused Reads: Separating Exploration from Reporting in Your Data Stack.
3. The Private SQL Client
- Senior engineers open their favorite SQL client.
- They run ad‑hoc queries locally.
- Some of those queries get copy‑pasted into Slack or a doc; most don’t.
Problems:
- The most important queries never leave someone’s laptop
- No shared trail, no shared learning
- Newer teammates can’t see how experts actually debug
All three patterns share the same flaw: the trail is incidental, not deliberate.
Designing a Single-Query Trail for Incidents
You don’t need a huge process change. You need a small, opinionated set of constraints.
1. Declare the Trail Early
The first time someone needs to touch production data for an incident, pause for 10 seconds:
- Pick the tool where the trail will live (for us, this is Simpl).
- Post the link in the incident channel: “All incident queries go here.”
- Encourage everyone to branch mentally, not tool-wise—stay in the same trail where possible.
This does two things:
- Signals that the trail is part of the incident, not an afterthought.
- Reduces the temptation to spin up three different SQL clients.
2. Anchor on the Incident’s Primary Key
Every incident has a “primary key,” even if it’s not literally a database primary key:
- A user ID
- An order ID
- A job run ID
- A shard/partition or region
- A specific deployment hash
Make your first few queries explicitly about that key:
- Find the main row(s) that represent the failing entity.
- Pull a narrow, focused view of that row over time.
- Identify the minimal set of related tables you’ll need.
This is where opinionated tools help. Instead of a full schema explorer, you want something like an anti-explorer view—a narrow, guided path through the relevant tables. We wrote more about that stance in The Anti-Explorer View: Why Less Navigating Makes Production Databases Feel Safer.
3. Keep the Surface Narrow on Purpose
During an incident, broad exploration feels useful. It’s usually just noisy.
Design your incident trail to encourage only the right questions:
- Default templates for:
- "Show me this user/order/job over the last N minutes"
- "Show me state transitions for this entity"
- "Show me related writes from service X"
- Guardrails that make unsafe reads hard:
- Hard limits on row counts
- Time-bounded queries by default
- Visual hints when a query fans out beyond the incident’s primary key
This is where a narrow query surface and guardrail UX patterns matter more than governance docs. If your incident trail lives inside Simpl, for example, the tool can:
- Nudge you toward parameterized, time-bounded reads
- Make it visually obvious when you’re leaving the incident’s scope
- Keep the query editor calm and single-mode instead of IDE-like
4. Treat Each Query as a Sentence in the Story
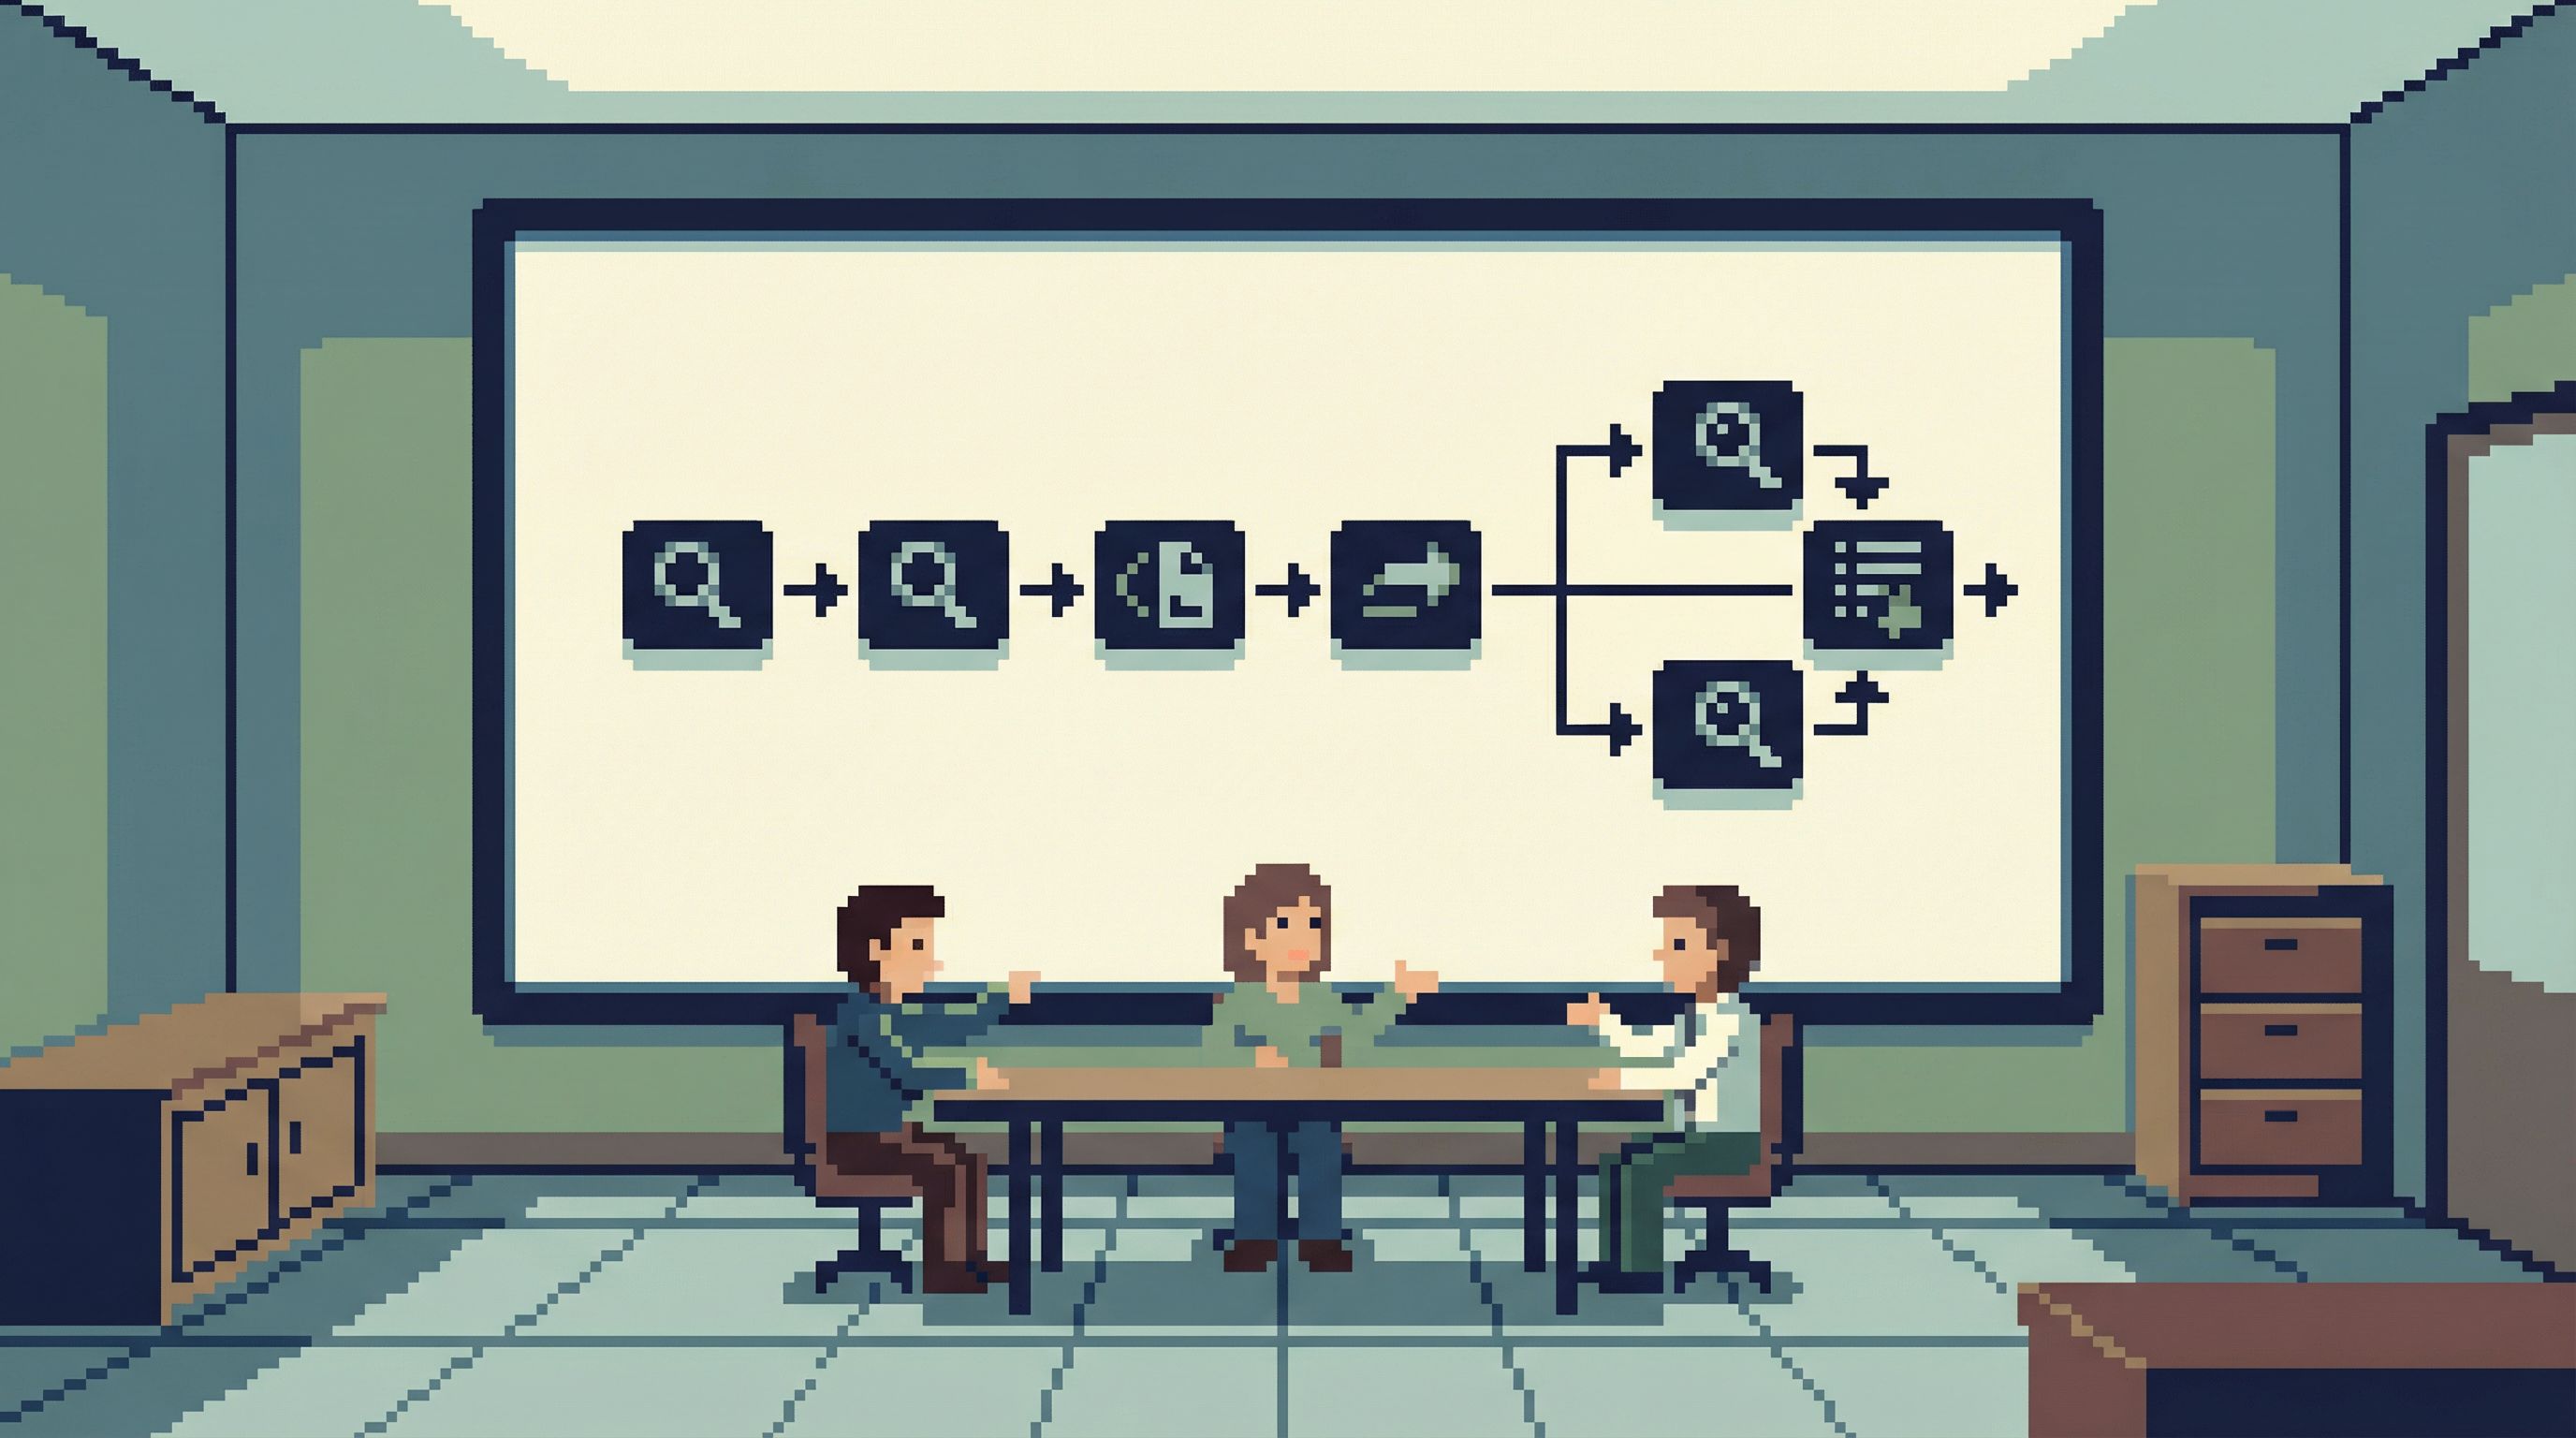
A good trail reads like a narrative:
-
What we suspected.
- Query: "Show all orders for user X in the last 24h."
- Note: "User reported duplicate charge around 10:05 UTC."
-
What we confirmed.
- Query: "Show payment events for those orders."
- Note: "We see two
payment_succeededevents with same external ID."
-
What we ruled out.
- Query: "Check idempotency keys for these payments."
- Note: "Idempotency keys differ; gateway retried with new key."
-
What actually happened.
- Query: "Show job runs for payment sync worker around that time."
- Note: "Worker retried after partial failure; we wrote a second charge."
The queries are simple. The value is in the sequence and the annotations.
Practically, this means your tool should make it trivial to:
- Attach short notes to each query
- See queries in strict chronological order
- Collapse dead-end branches without deleting them
5. End the Trail with a Check, Not a Theory
The last queries in the trail shouldn’t just say, “We think this is fixed.” They should demonstrate it.
Examples:
- After a fix, re-run the core incident query against a fresh example.
- Add a query that verifies invariants you expect to hold now.
- Save a small “regression suite” of reads that future you can replay.
This is where the single-query incident review becomes reusable:
- For regression checks before a deploy
- For training new on-call engineers
- For verifying that similar incidents really are “the same class”
Making This Work With Your Existing Stack
You don’t need to rebuild your tooling from scratch. You do need to be intentional about where the trail lives and how people touch production.
Choose One Home for the Trail
Pick a single tool where you will:
- Run most incident-related reads
- Capture the linear query history
- Share links during the incident and review
For many teams, a purpose-built browser like Simpl is a better fit than a full SQL IDE or BI tool:
- Read-first, with guardrails for production
- Opinionated about narrowing scope
- Designed for sharing and replaying query trails
Put Guardrails Before Governance
Policy docs don’t help much when someone is staring at a blinking cursor during an outage.
Instead, make the safe thing the default by:
- Enforcing read-only roles in the incident browser
- Baking in LIMITs and time windows for all ad-hoc queries
- Disallowing cross-environment connections in the same session
If you want to go deeper here, we unpacked this idea in Guardrails Before Governance: A Practical Approach to Safer Day‑to‑Day Database Access.
Normalize the Replay
A single-query incident review only pays off if people actually use it.
Make replay part of your normal rhythm:
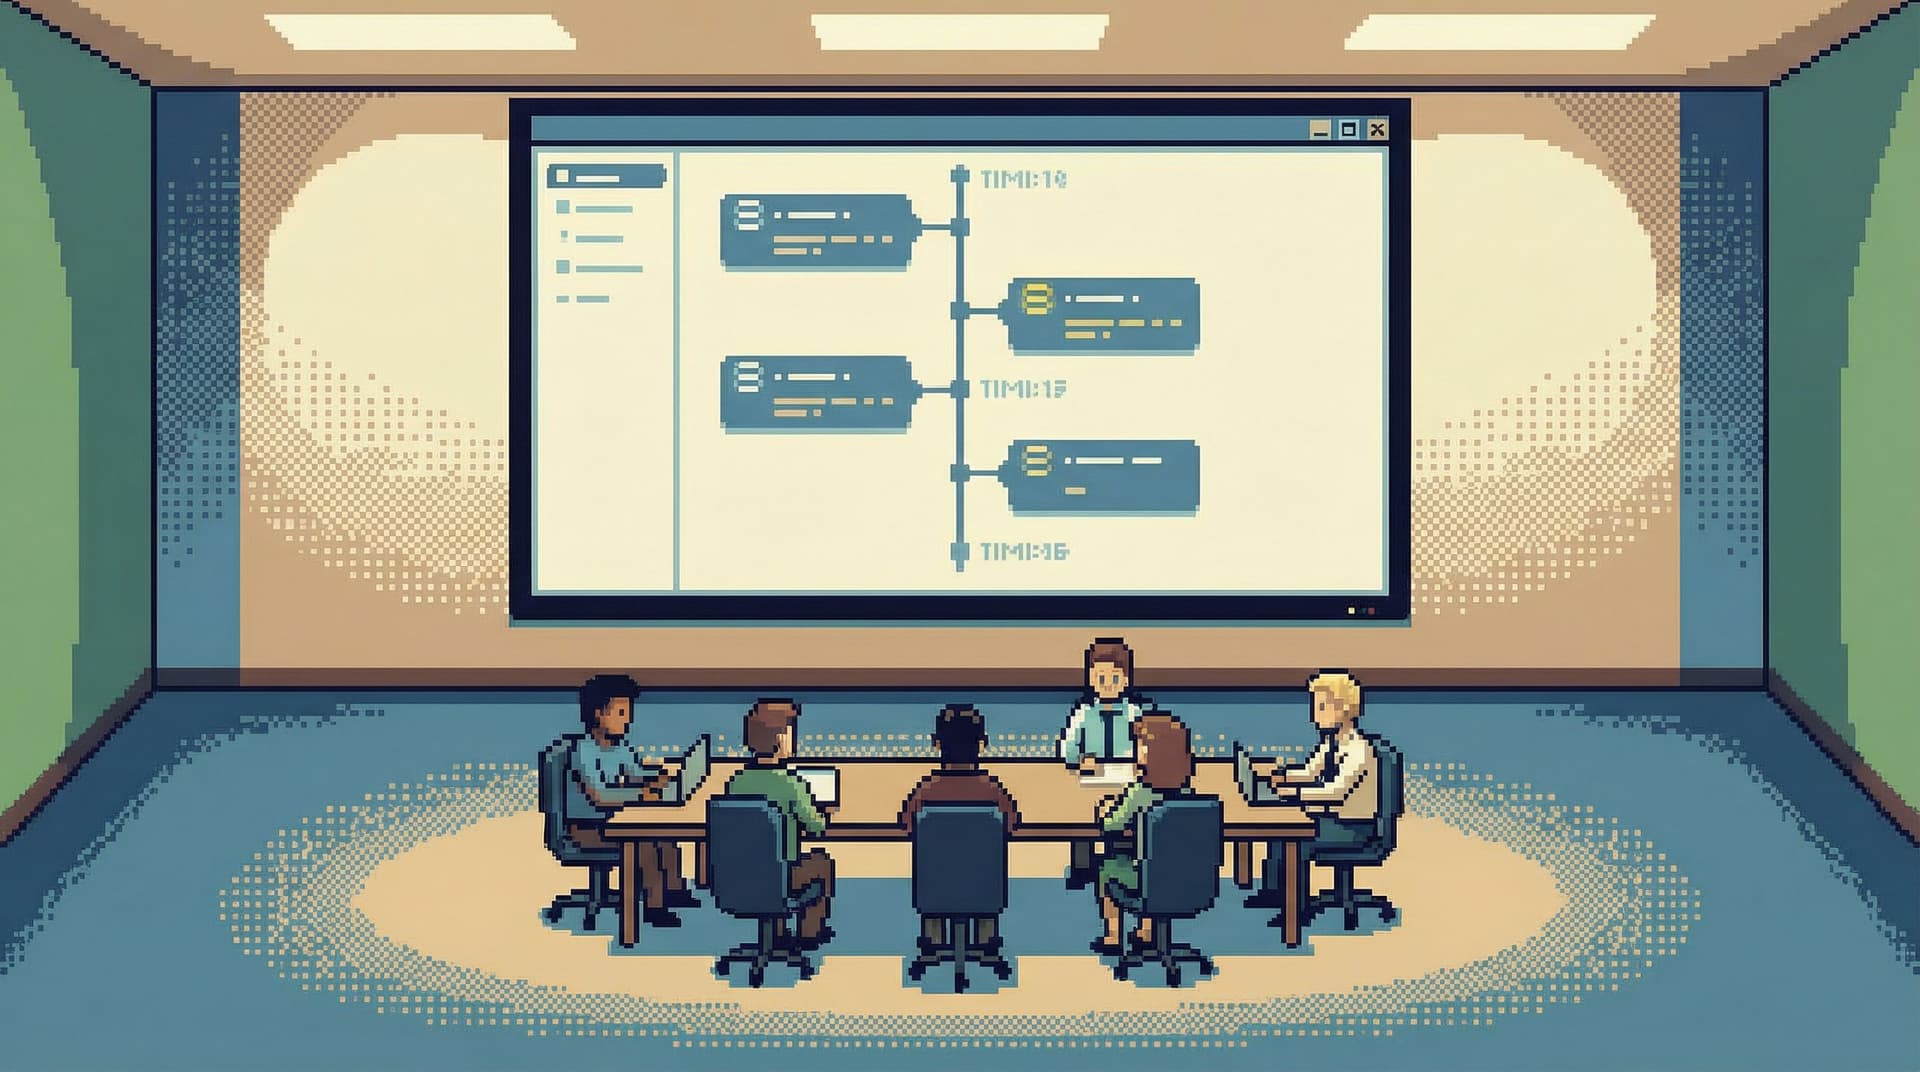
- During the postmortem:
- Open the trail and step through it live.
- Resist the urge to jump around; follow the sequence.
- For on-call training:
- Pick a past incident and replay the trail as an exercise.
- Ask, “Where would you have stopped? What else would you have checked?”
- Before risky changes:
- Re-run regression queries from relevant past incidents.
- Confirm that the same failure mode isn’t silently recurring.
Over time, you’ll build a small library of incident trails that act like living runbooks—grounded in real data, not hypothetical scenarios.
A Minimal Workflow You Can Start Using This Week
You don’t need a perfect system to get value. You just need a repeatable one.
Here’s a simple workflow you can adopt with almost any stack:
- Pick the trail tool.
- Decide where incident queries live (ideally a read-first browser like Simpl).
- Name the trail.
- Use a consistent pattern:
INC-1234_user-double-charge_2026-03-12.
- Use a consistent pattern:
- Anchor the first query.
- Start with the incident’s primary key and a narrow time window.
- Stay linear.
- For each new question, either:
- Extend the current trail, or
- Deliberately fork a new labeled trail (rare).
- For each new question, either:
- Annotate lightly.
- One sentence per query: what you were checking, what you found.
- Close with verification.
- Add at least one “post-fix” query that demonstrates the system behaving correctly.
- Link the trail in the postmortem.
- Instead of screenshots, link to the replayable trail.
You can tighten this over time. The important part is to start treating the trail as a first-class artifact, not an accident.
Summary
A single-query incident review is a calm way to replay outages from one coherent data trail instead of a maze of tools and screenshots.
Key ideas:
- One trail per incident. All meaningful reads live in a single, shared place.
- Linear, not sprawling. Queries form a clear narrative from first suspicion to final verification.
- Anchored in real keys. User IDs, order IDs, job IDs—whatever uniquely identifies the incident story.
- Guardrailed by design. Read-first tools, narrow surfaces, and UX guardrails keep production safe.
- Replayable on demand. Trails become reusable assets for reviews, training, and regression checks.
You don’t need more dashboards or heavier governance to get here. You need a calmer stance toward production data, and a tool that treats query trails as the core unit of work.
Take the First Step
You don’t have to redesign your entire incident process to benefit from this.
For your next incident:
- Choose a single place where all production reads will happen.
- Anchor the first query on the incident’s primary key and time window.
- Commit to keeping the trail linear and lightly annotated.
- Replay that exact trail during the review.
If you want a tool that’s built around this way of working, try Simpl. It’s an opinionated database browser designed for calm, read-first work—especially the kind you need when everything else feels noisy.
Start with one incident. One trail. One calmer review.
Then keep going.