The Calm Incident Console: Designing Database Sessions That Mirror How Outages Actually Unfold

Incidents don’t happen as clean diagrams or tidy timelines.
They unfold as half-remembered alerts, half-formed hunches, and a growing set of “wait, that’s weird” moments. Your database console is where many of those moments either sharpen into clarity—or dissolve into noise.
Most teams still debug outages from tools that were never designed for this:
- Full SQL IDEs with every feature turned on
- Admin panels that mix reads, writes, and configuration
- BI tools pretending to be incident consoles
The result is familiar: wandering queries, scattered context, and incident reviews that feel like forensic archaeology.
A calmer way is possible: treat incident response as a first-class mode of database work, and design the console around how outages actually unfold.
A calm incident console is not a new category of tool. It’s a stance:
- Incidents are read-first, not write-first.
- Sessions are linear stories, not tab explosions.
- Guardrails and defaults carry more weight than policies and heroics.
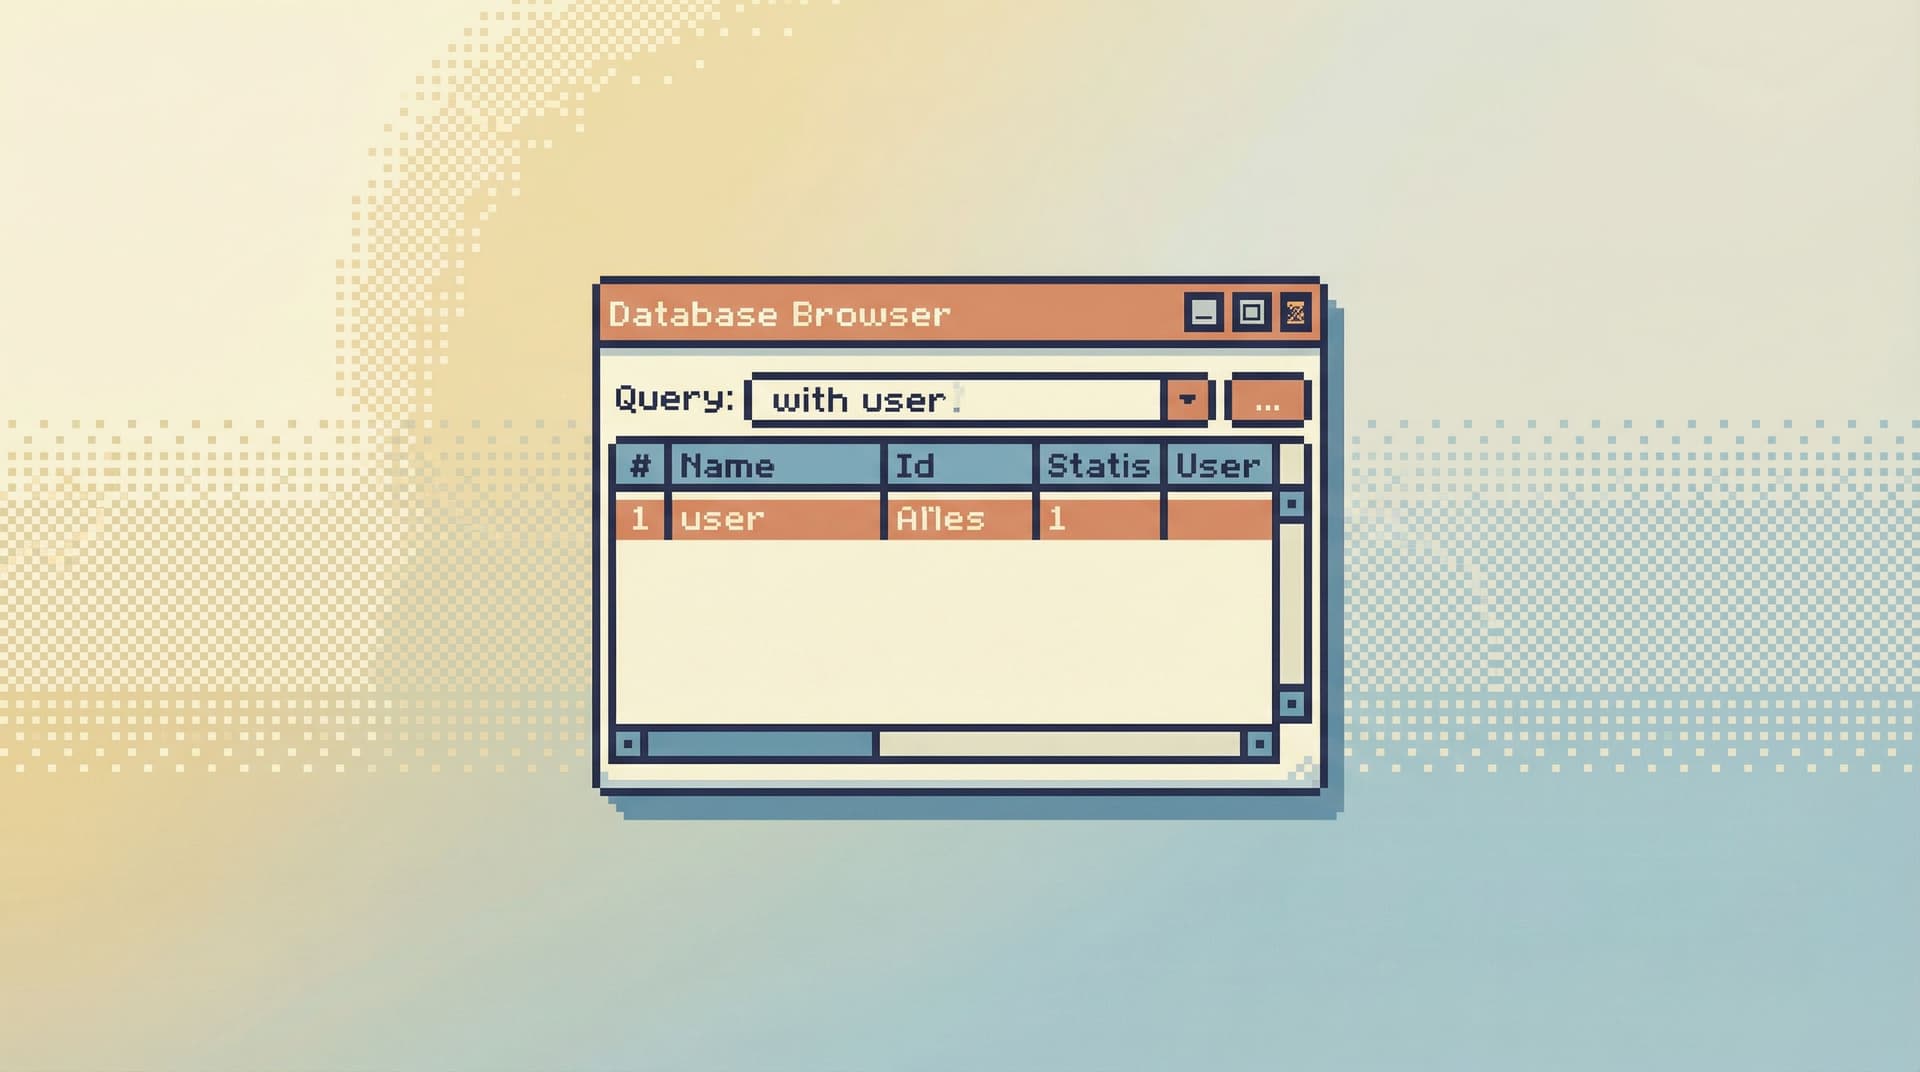
Tools like Simpl exist exactly for this space: opinionated database browsers that make it easier to explore and understand production data without the noise of full BI or admin suites.
Why incident sessions deserve their own design
Incidents are different from everyday querying:
- Time pressure is real. You’re not “exploring data.” You’re trying to stop user impact.
- The blast radius is unknown. You rarely know which tables or services matter at the start.
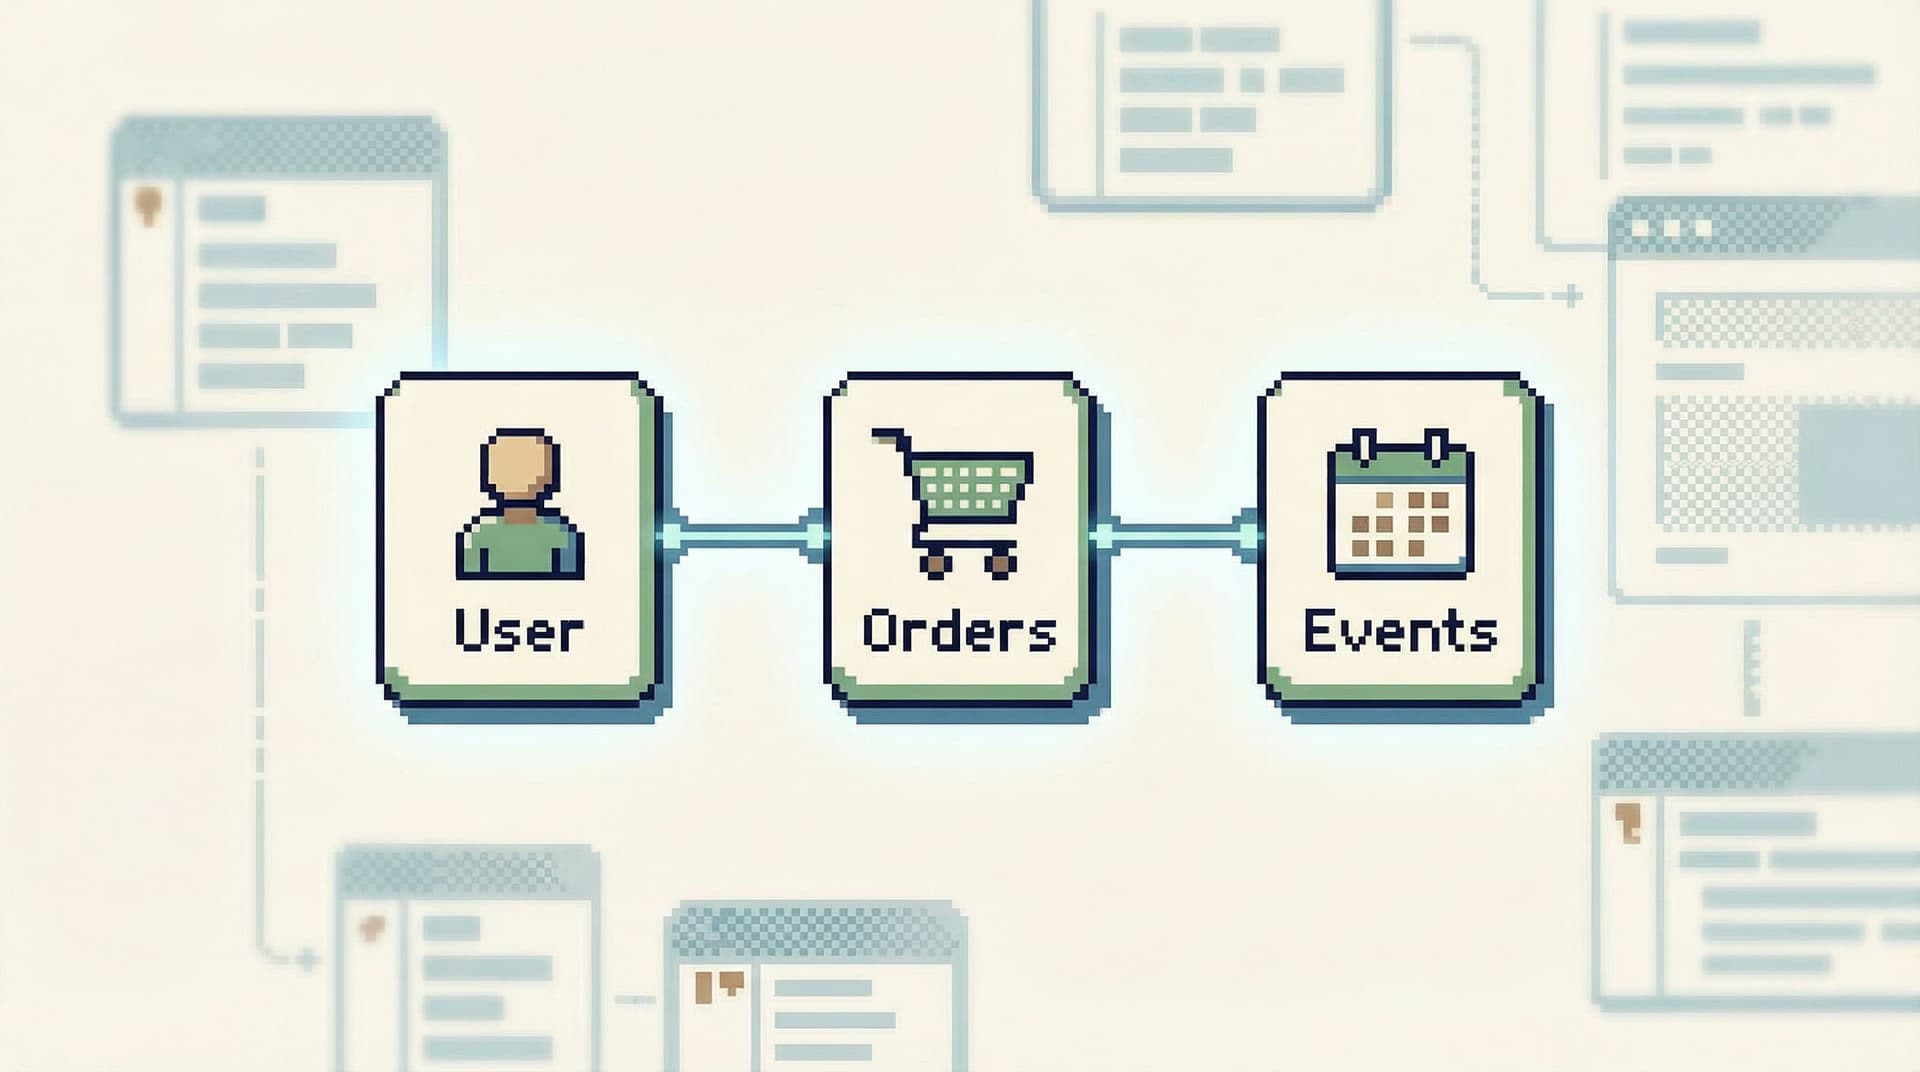
- The story crosses boundaries. One user, one order, one job—spanning multiple tables and timestamps.
- You need a replayable trail. Afterward, you must show what you saw and when.
Most consoles ignore these realities. They optimize for power and flexibility instead of:
- Narrowing your focus
- Capturing your trail
- Guiding you through a coherent narrative of the outage
If you’ve ever tried to reconstruct an incident from scattered SQL history, screenshots, and Slack pastes, you’ve felt this gap. Posts like “The Single-Query Incident Review: Replaying Outages from One Calm Data Trail” and “Production Reads Without the Rabbit Holes: Structuring Safe, Linear Debugging Sessions” dig into this problem from different angles. This post focuses on the console itself.
How outages actually unfold (and what your console should reflect)
Most real incidents follow a loose pattern:
- Trigger – An alert fires, a customer reports a bug, a dashboard looks off.
- Anchor – You pick a concrete anchor: a user ID, order ID, job ID, or specific time window.
- Local story – You reconstruct what happened to that anchor over a short timeline.
- Expansion – You look “one step out”: related tables, upstream/downstream services.
- Hypothesis – You form a concrete theory about what went wrong.
- Verification – You test that theory against more rows and time windows.
- Fix & follow‑through – You mitigate, then capture the story for review.
A calm incident console should mirror this flow. That means designing sessions around:
- Anchors instead of arbitrary starting points
- Timelines instead of static grids
- Linear trails instead of tab forests
- Guardrails instead of “be careful” culture
Let’s walk through what that looks like in practice.
Principle 1: Start from an anchor, not a schema
During an outage, you rarely think in tables. You think in anchors:
- A specific user
- A specific order
- A specific background job
- A specific time window around an alert
Yet most tools still drop you into:
- A schema tree on the left
- A blank editor in the middle
- A results grid at the bottom
You’re forced to translate “user 123 had a bad experience at 03:12” into “which tables do I even care about?”
A calm incident console flips this:
- Primary entry is anchor-first, not schema-first.
- You can start a session from a user ID, order ID, or event correlation ID.
- The console preloads relevant views and queries tied to that anchor.
Patterns that help:
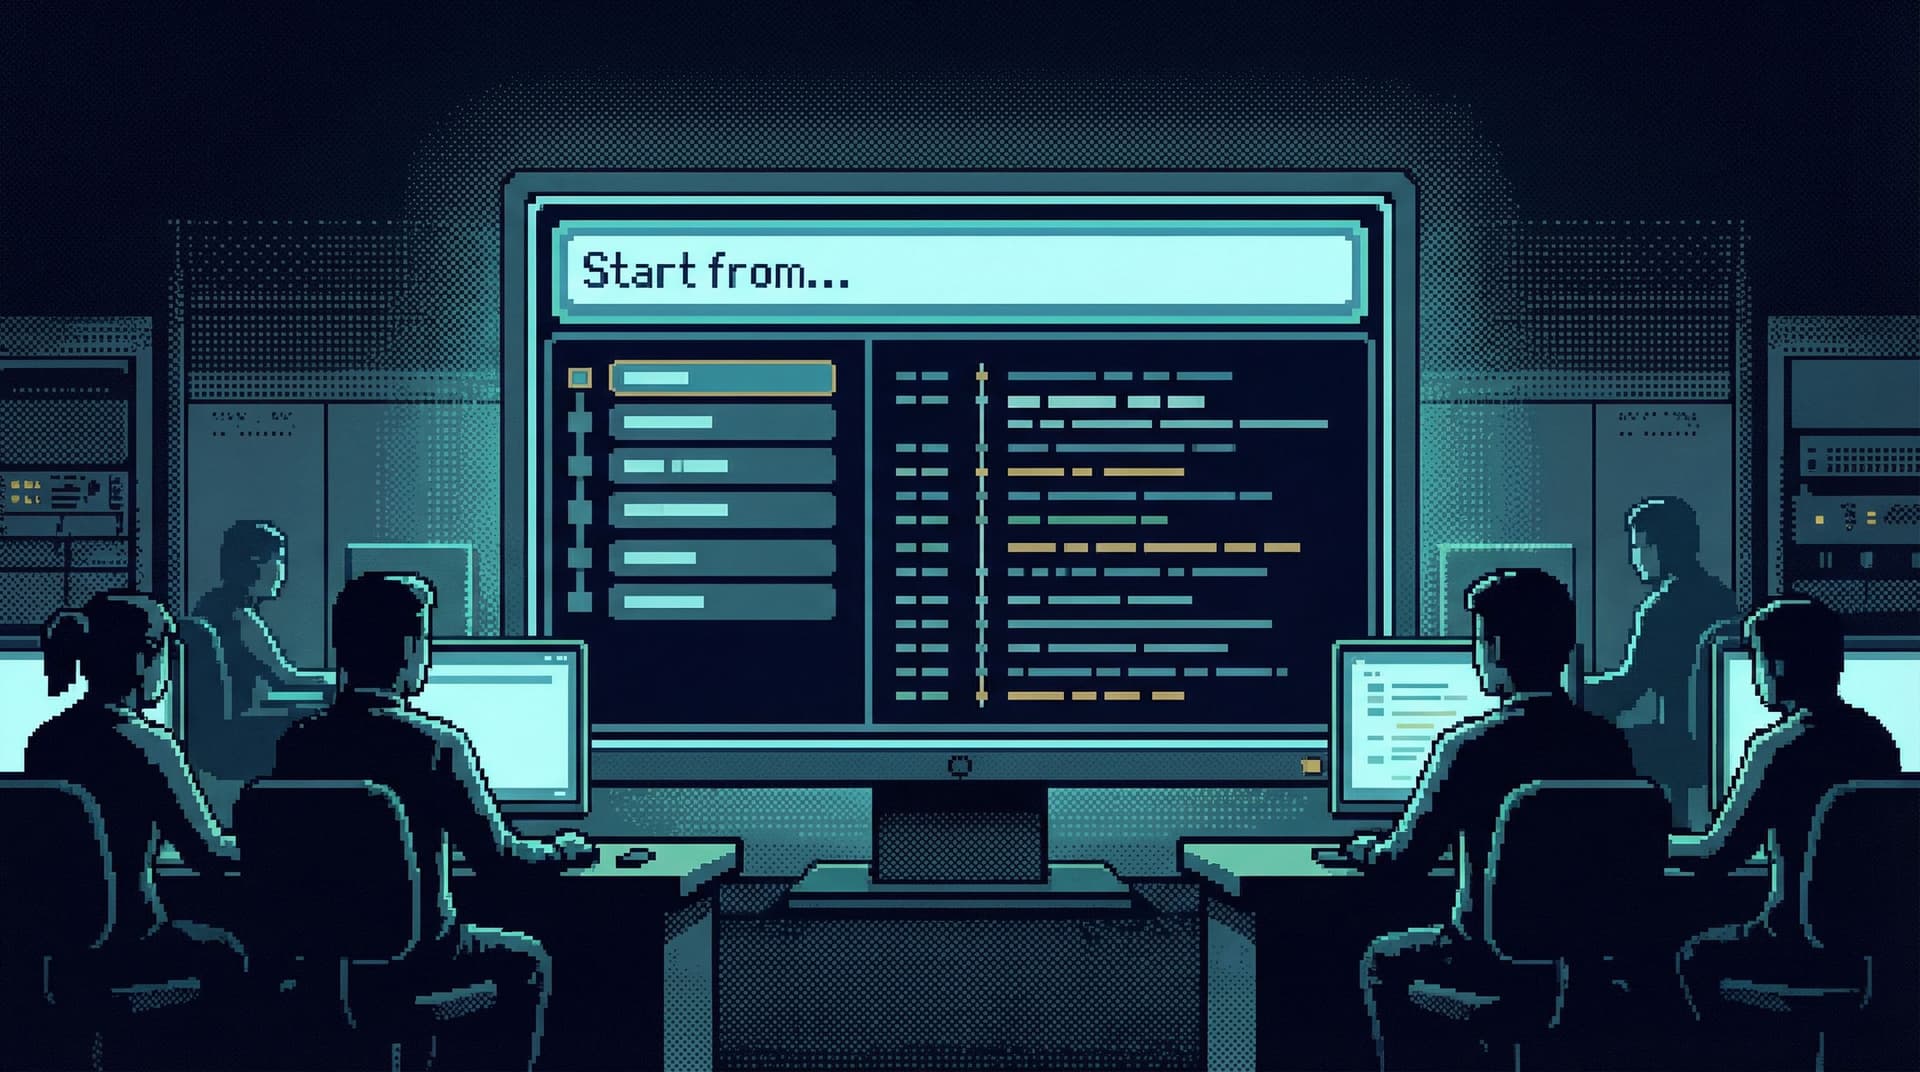
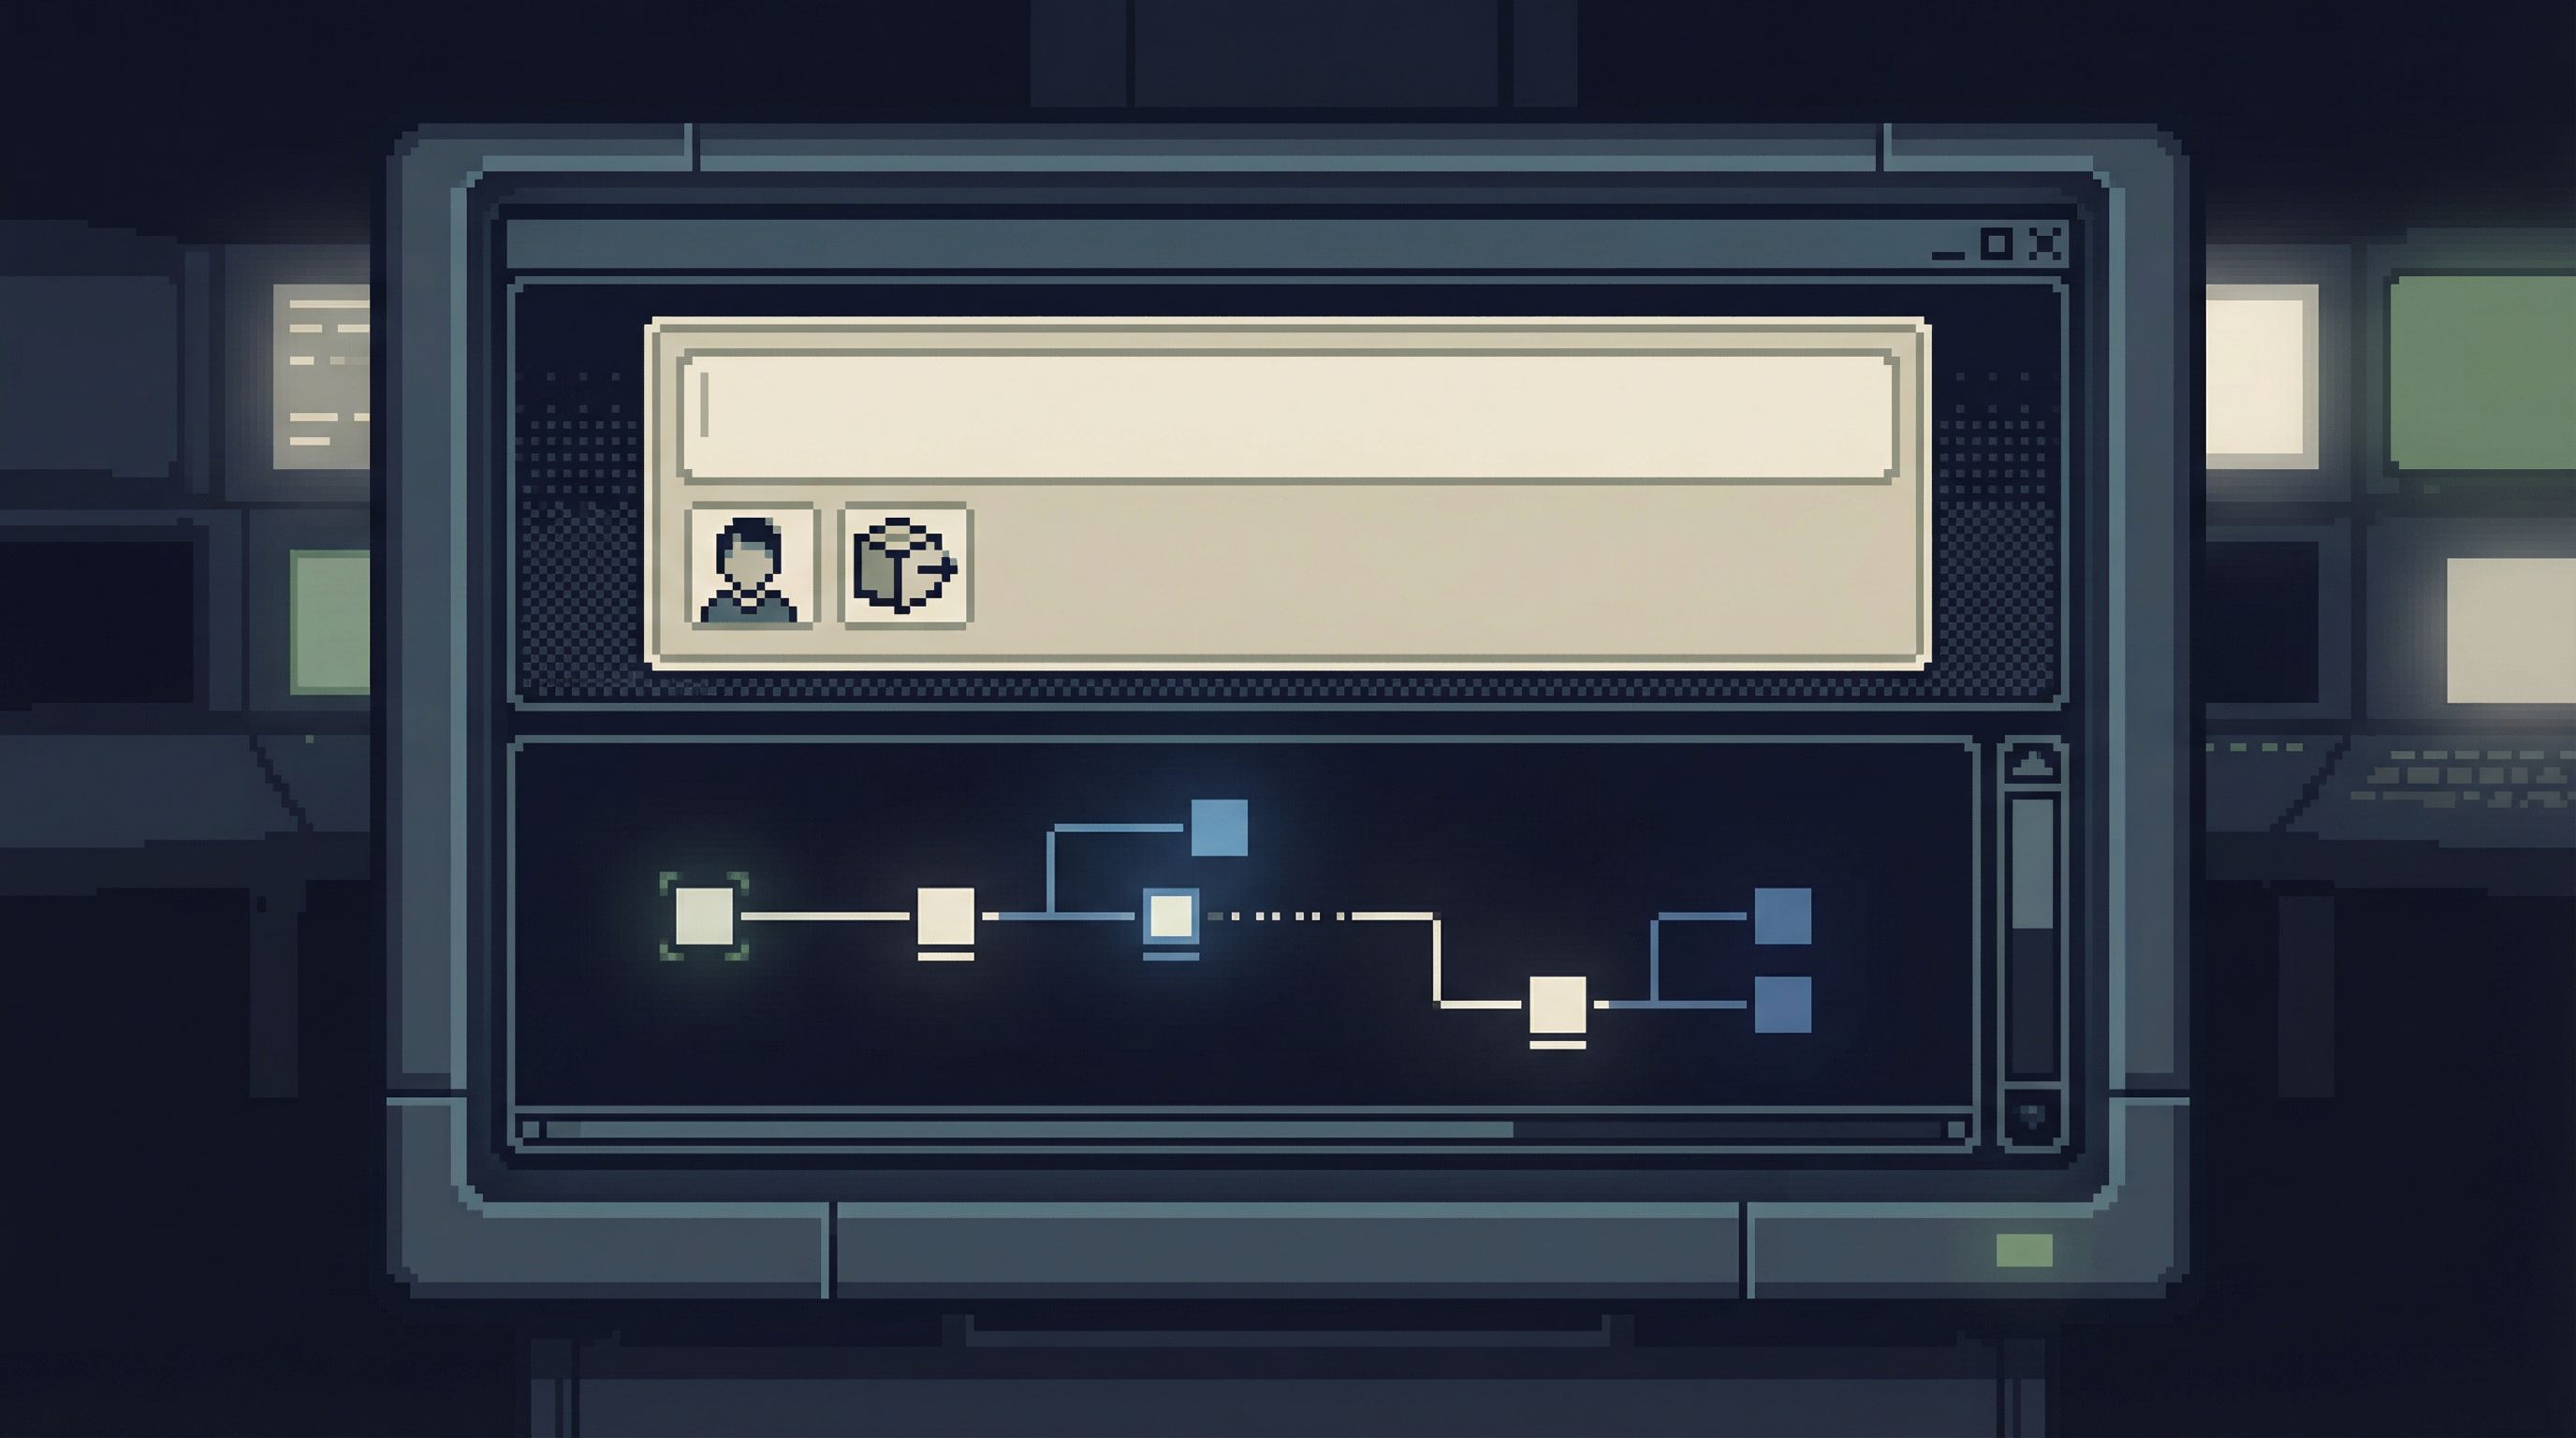
- A single “Start from…” field that accepts:
user:12345order:abc-123at:2026-03-21T03:12Z
- Saved “incident entry” views that:
- Pull the last N events for that user
- Show recent jobs touching that order
- Surface key state transitions around a timestamp
“Beyond Table Lists: Opinionated Navigation Patterns for Real-World Production Reads” goes deeper into this anchor-first stance. For incidents, it’s not a nice-to-have; it’s the difference between a 2-minute and a 20-minute start.
Principle 2: Make the incident a timeline, not a table dump
Incidents are temporal stories:
- “What changed between 03:10 and 03:15?”
- “What did this job do before it failed?”
- “Did we send two emails or just log twice?”
Most consoles answer with unordered grids of rows. You can sort by created_at, but the interface doesn’t treat time as the spine of the story.
A calm incident console does:
- Time is first-class. Every view assumes you care about “before” and “after.”
- Events are sequenced. You see a unified stream of relevant rows, ordered in time.
- Context is layered, not scattered. You can expand an event to see related rows without losing your place.
Concrete design moves:
- Default to time-ordered views for incident sessions.
- Group related events (e.g., status changes, retries, notifications) into a single chronological stream.
- Let people pin key moments (“first failure”, “retry succeeded”, “user refunded”) along the timeline.
Tools like Simpl can lean into this by offering opinionated “incident timelines” that stitch together rows from multiple tables into a single, read-only narrative.
Principle 3: Treat the session as a single calm trail
Most incident consoles behave like generic SQL clients:
- Multiple tabs
- Multiple queries half-finished
- History scattered between local clients, browser history, and screenshots
That’s how you end up with incident reviews that feel like guesswork. No one can see the actual path you took.
A calm incident console assumes:
- One incident = one trail. Everything you run is part of a single linear story.
- The trail is visible. Queries and key results are captured as steps you can scroll.
- The trail is shareable. Someone else can open the same trail and replay it.
If you’ve read “The One-Query Mindset: Structuring Database Work to Avoid Cognitive Thrash”, this will feel familiar. For incidents, the same idea scales up from “query” to “session.”
Practical patterns:
- Replace “tabs” with a step list down the side:
- Step 1: Load user 12345’s recent sessions
- Step 2: Fetch all orders for user 12345 in last 24h
- Step 3: Inspect failed payment attempts
- Step 4: Compare job logs around 03:12
- Each step shows:
- The query (or named view) that ran
- A compact preview of results
- A timestamp and who ran it
- Let people annotate steps:
- “First time we see duplicate charges”
- “Hypothesis: retry logic misconfigured”
This structure turns a chaotic console history into a readable narrative.
Principle 4: Guardrails before governance
Most teams try to make incident querying safer with policy:
- “Don’t run wide SELECTs on hot tables.”
- “Always add LIMIT in production.”
- “Ask before touching this schema.”
Under pressure, those rules evaporate. The console is what your hands feel.
A calm incident console bakes safety into the experience:
- Reads are constrained by default. Time windows, limits, and filters are not optional.
- Dangerous patterns are hard. Wide scans, unbounded joins, and cross-environment mixups are friction-full.
- The interface reflects risk. A query that can hurt production looks and feels different.
Some practical UX guardrails (see also “Guardrails in the Query Editor: UX Patterns That Make Unsafe Reads Hard by Default”):
- Time-bounded defaults in incident mode:
- Always require a time window.
- Make expanding the window an explicit action with clear copy.
- Soft caps before hard failures:
- Warn and require confirmation for large result sets or heavy scans.
- Offer safer alternatives (“sample 1%”, “aggregate by minute”).
- Environment clarity everywhere:
- Prominent, persistent indication of prod vs staging.
- Copy-paste safe links that include environment in the URL and UI.
Tools like Simpl can treat “incident mode” as a distinct context: same underlying database, different defaults and constraints.
Principle 5: Design for handoffs and reviews from the start
An incident doesn’t end when the alert stops firing. It ends when:
- The story is clear.
- The fix is understood.
- The risk of recurrence is lower.
That requires replayable evidence, not just a hunch and a memory.
A calm incident console should make this cheap:
- Every session is a shareable artifact. A URL that opens the exact trail, with queries, parameters, and key results.
- Snapshots instead of screenshots. You can capture “what we saw at 03:14” as a saved state, not a PNG.
- Lightweight exports. Turn the trail into a structured outline for your incident doc.
Patterns that help:
- A “Mark for review” toggle on steps that matter.
- A compact incident summary auto-generated from the trail:
- Anchor (user/order/job)
- Time window
- Key tables touched
- Hypotheses tested
- Final explanation
- Tight integration with your incident docs or ticketing system via links, not embedded screenshots.
This is where a purpose-built browser like Simpl can serve as the quiet backbone for both live response and later analysis, instead of forcing teams to reconstruct the story from scattered tools.
Putting it together: A calm incident session, step by step
Here’s how a real incident session might look in a console designed this way.
Scenario: Payments are intermittently failing for some users around 03:12 UTC.
-
Open the incident console in incident mode
- Environment clearly labeled as production.
- Time window defaulted to the last 2 hours.
-
Anchor the session
- Start from a specific failing
order_idoruser_idfrom logs or alerts. - The console loads a time-ordered view of events for that anchor.
- Start from a specific failing
-
Follow the local story
- You see:
- Order created
- Payment intent created
- Retry attempts
- Final failure
- You pin “first failure” and “last retry” as key steps.
- You see:
-
Expand one step out
- From the payment failure event, you jump (within the same trail) to:
- Related background jobs
- Downstream provider responses
- Each jump becomes a new step in the trail, not a new tab.
- From the payment failure event, you jump (within the same trail) to:
-
Form a hypothesis
- For example: “Retries are happening too quickly after a specific provider error.”
- You annotate the relevant step with this hypothesis.
-
Verify safely
- You run a parameterized query across a broader time window:
- All failures with that error code over the last 24 hours.
- The console enforces a time-bound and row limit by default.
- You get aggregated counts and a small sample of rows.
- You run a parameterized query across a broader time window:
-
Capture the trail
- You mark key steps for review.
- The console generates a summary:
- Anchor:
order:abc-123 - Time window:
03:00–04:00 UTC - Key tables:
orders,payments,jobs,provider_responses - Hypothesis and evidence.
- Anchor:
-
Share and review
- You drop a single link into the incident channel.
- During the post-incident review, you replay the trail instead of guessing from memory.
This is not theoretical. Almost every pattern above can be layered on top of your existing databases with a focused browser like Simpl, without introducing another heavyweight admin panel or BI surface.
Where to start if you’re designing or choosing a console
You don’t need to rebuild your stack to get a calmer incident console. Start with a few deliberate moves:
-
Name “incident mode” explicitly
- Whether in your own tools or in how you use Simpl, treat incident sessions as a distinct context.
- Different defaults: time windows, limits, and views.
-
Introduce anchor-first entry
- Add a single “Start from…” field that accepts IDs and timestamps.
- Wire it to prebuilt views that tell a local story for that anchor.
-
Replace tab chaos with a visible trail
- If you’re stuck with a traditional SQL client, simulate this with:
- A shared doc where each query and result link is a numbered step.
- If you control the tool, make the trail the primary navigation pattern.
- If you’re stuck with a traditional SQL client, simulate this with:
-
Bake in a few guardrails
- Enforce time-bounded queries in production.
- Add warnings for large scans or missing limits.
- Make environment labels impossible to miss.
-
Make reviews a first-class outcome
- Decide how a session becomes an artifact:
- A saved trail in your browser tool
- A structured template in your incident docs
- Practice one or two incidents this way before the next real one.
- Decide how a session becomes an artifact:
If you want more on the habits side, “Mindful Querying: Practices for Staying Focused While Debugging Live Data” pairs well with this post: it focuses on how people behave inside the console, not just how the console behaves.
Summary
A calm incident console starts from a simple observation: outages are stories, not screenshots.
Designing database sessions that mirror how incidents actually unfold means:
- Anchors over schemas – Start from user/order/job IDs and time windows, not table trees.
- Timelines over grids – Treat time as the spine of the story.
- Trails over tabs – One linear, shareable path instead of scattered history.
- Guardrails over guidelines – Safer defaults and constraints instead of “be careful” culture.
- Artifacts over memories – Sessions that turn into replayable evidence for reviews.
Tools like Simpl are well-suited to this stance: opinionated, read-first, and designed around real debugging questions instead of generic schema exploration.
Take the first step
You don’t need a perfect incident console to make a real difference. You just need to make incident sessions feel a little more like a calm, linear story and a little less like a scramble.
Pick one of these moves and implement it this week:
- Add an anchor-first “Start from…” pattern to your current tooling.
- Enforce time-bounded, limited queries in production.
- Run your next incident review from a single shared trail instead of scattered screenshots.
If you’re ready to try a purpose-built browser for this kind of work, explore how Simpl can serve as your calm incident console—one place where production reads stay focused, linear, and replayable.