The Minimalist Data Stack: What Actually Belongs Between Your CLI and Your BI

Most teams don’t suffer from a lack of data tools.
They suffer from a surplus of layers between where the data lives and where the charts appear.
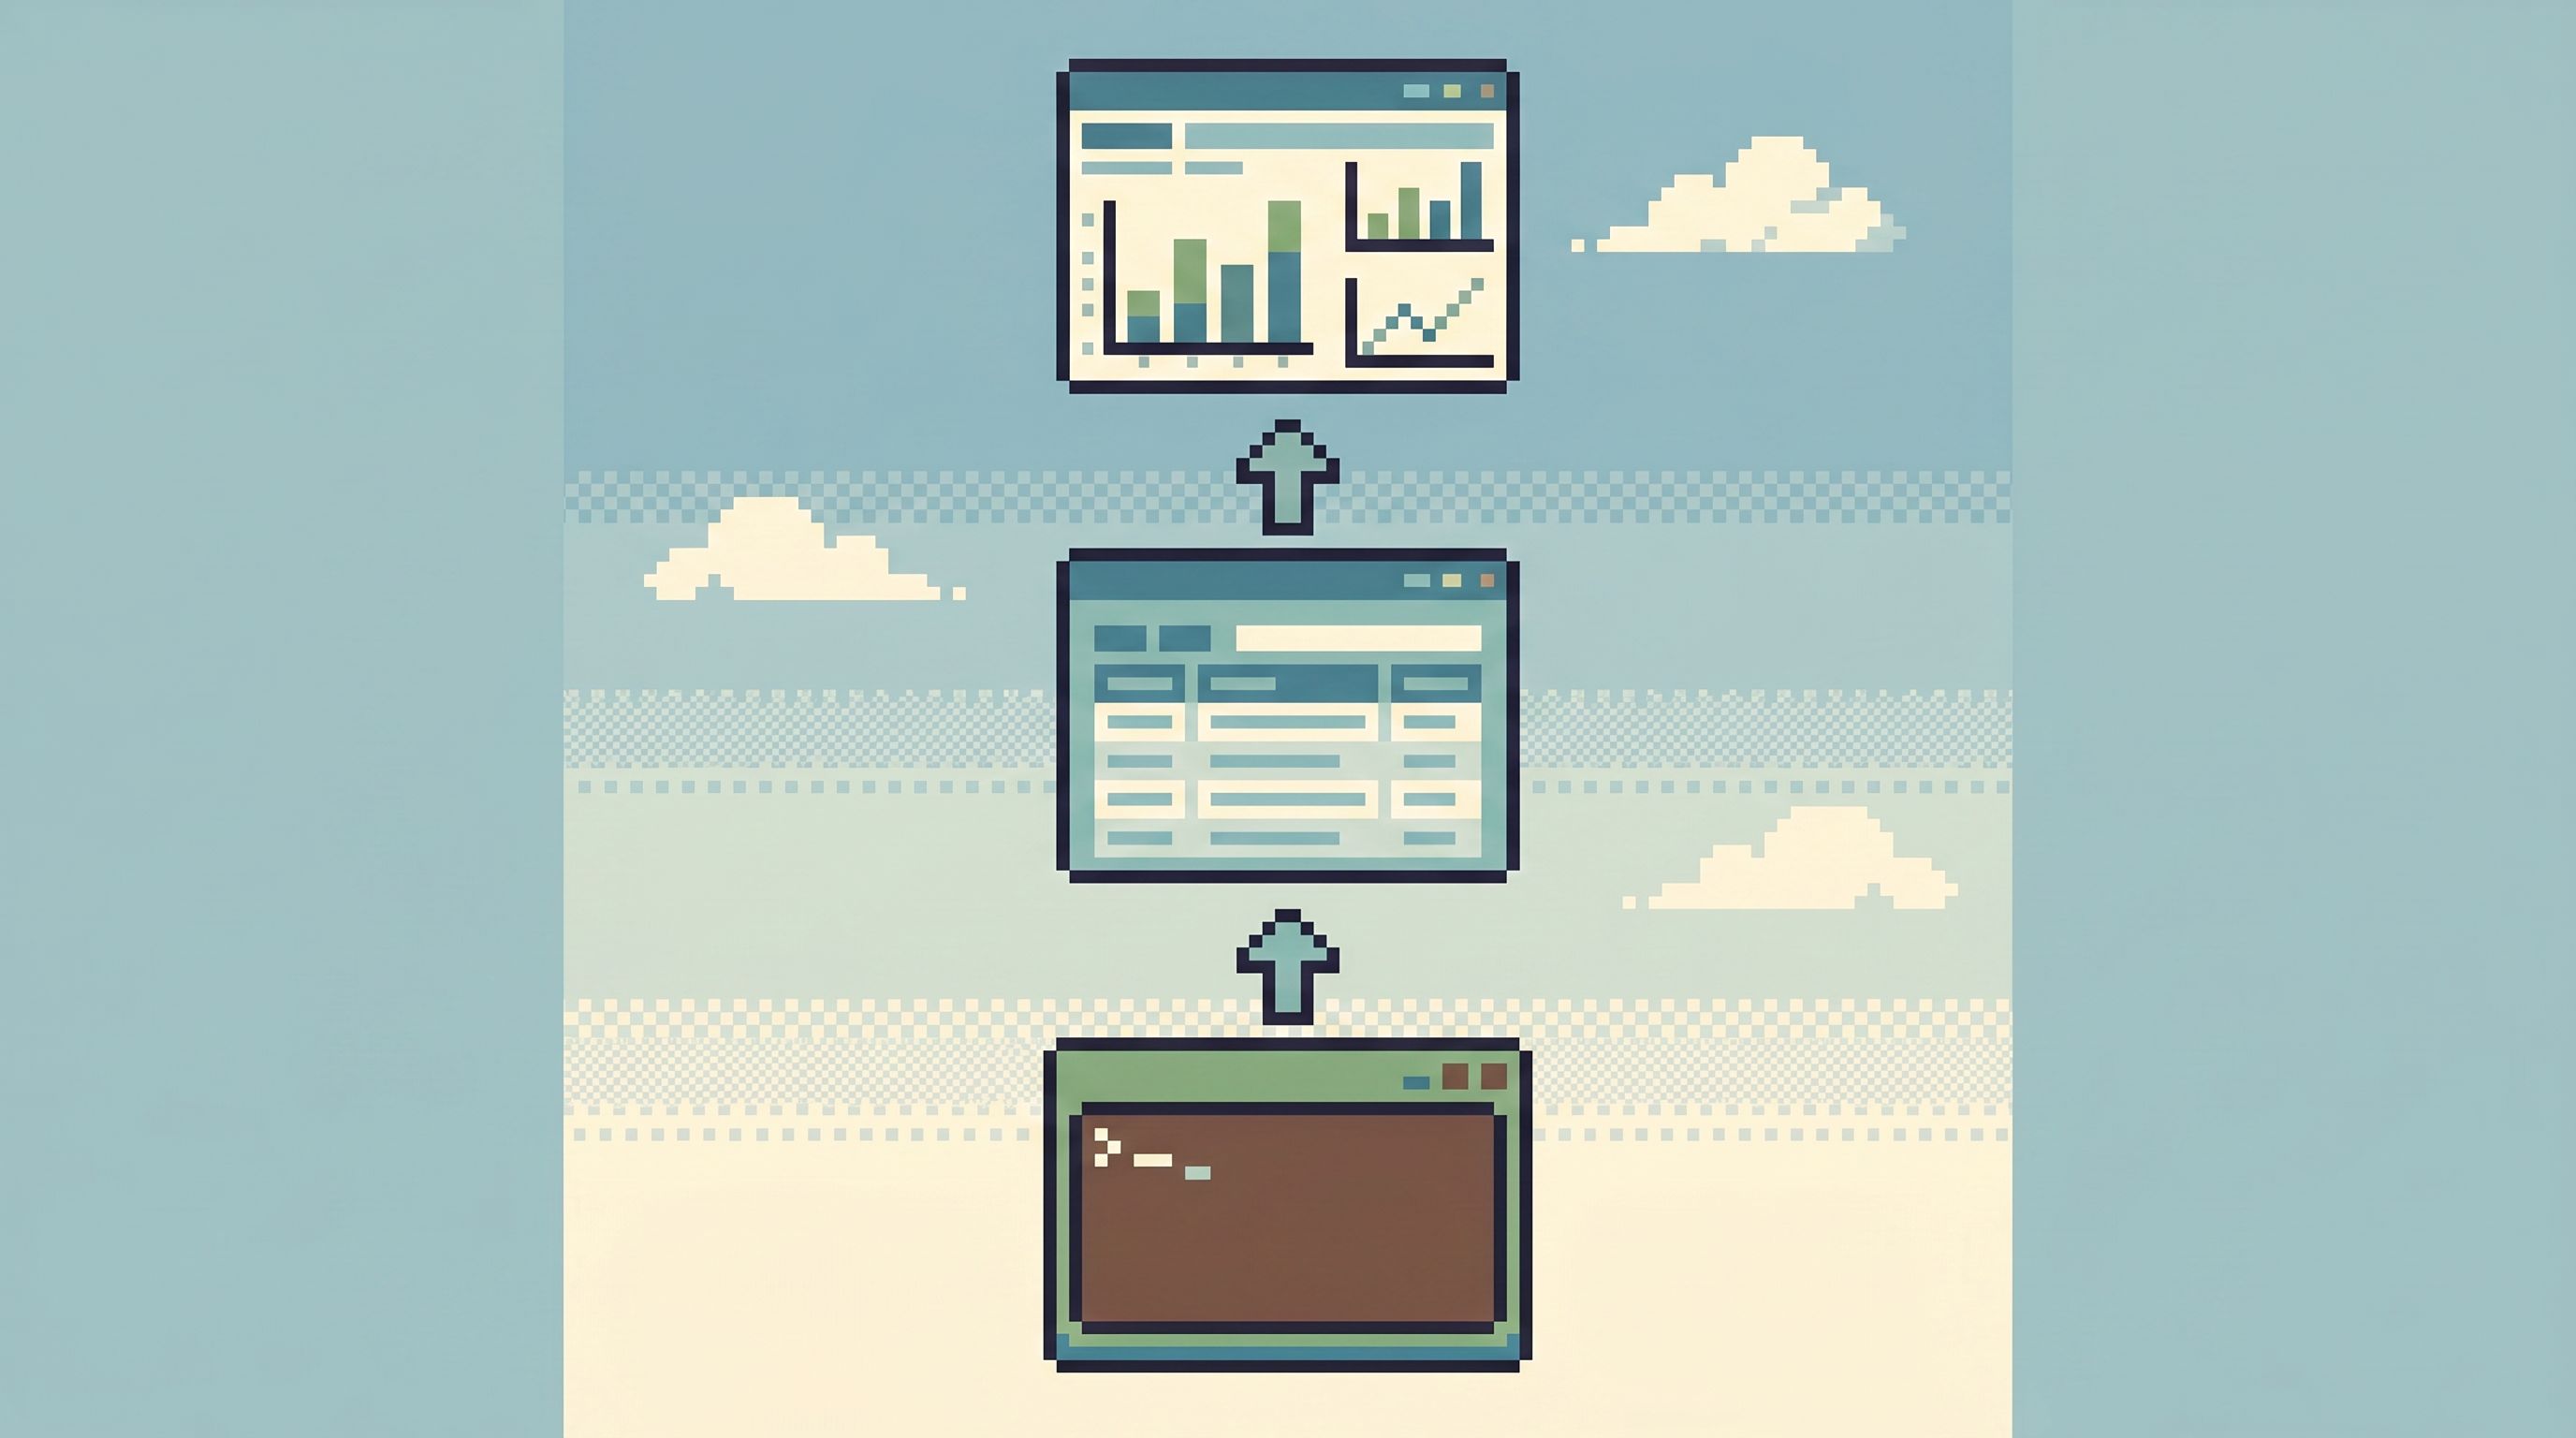
On one side, you have:
- The CLI — psql, mysql, sqlite,
bq,snowflake,psqlin a tmux pane. - On the other, your BI tool — Looker, Metabase, Mode, Power BI, Hex.
In between, the modern data stack has grown dense: ingestion, orchestration, transformation, semantic layers, feature stores, reverse ETL, notebooks, catalogs, quality platforms, and more. For some organizations and scales, that’s warranted. For many engineering teams, it’s not.
This post is about the thin middle: the minimal set of tools that actually need to exist between your CLI and your BI — and what can be safely left out.
It’s also about a calmer way to work with production data: fewer surfaces, clearer roles, and one focused place to read what’s going on. That’s the gap tools like Simpl are built to sit in.
Why this middle layer matters
Most of the pain engineers feel around data doesn’t come from the warehouse, or from the dashboards. It comes from everything in between:
- Context switching across tools and tabs.
- Unclear ownership of queries, models, and debug flows.
- Shadow access via screenshots, CSV exports, and private notebooks.
- Slow incident response because the one person who “knows the query” is offline.
Recent surveys of knowledge workers show that people lose hours each week just moving information between systems and reconciling conflicting numbers, rather than doing the actual work of understanding and deciding. That’s exactly what happens when every layer of the stack has its own UI, query model, and concept of truth.
A minimalist data stack doesn’t mean “no tools.” It means:
- Each layer has a narrow, legible purpose.
- There’s one obvious place to do a given kind of work.
- The path from “alert” to “rows” to “decision” is short and repeatable.
That middle layer — between raw SQL and polished dashboards — is where you can reclaim the most calm.
The temptation: a tool for every concern
The popular modern stack pattern looks something like:
- Ingestion – Fivetran, Airbyte, custom jobs.
- Warehouse / Lakehouse – Snowflake, BigQuery, Databricks.
- Transformation – dbt.
- Orchestration – Airflow, Dagster, Prefect.
- Semantic layer / metrics – Transform / dbt metrics, Cube.
- BI – Looker, Power BI, Mode, Metabase, etc.
- Reverse ETL / activation – Hightouch, Census.
- Catalog / lineage / quality – Alation, Atlan, Monte Carlo.
- Notebooks & IDEs – Jupyter, Hex, DataGrip.
Each piece solves a real problem. At scale, many teams genuinely need most of this. But “real problem” is not the same as “your problem, right now.”
For a lot of engineering‑led product teams, this stack is overfitted to analytics and underfitted to day‑to‑day debugging and operations. You end up with:
- Dashboards that tell you something is wrong, but not what happened.
- SQL IDEs pointed at production that feel risky to even open.
- Ad‑hoc queries scattered across notebooks, private folders, and Slack messages.
That’s the gap the minimalist middle layer needs to fill.
The minimalist frame: three kinds of work
Instead of starting from tools, start from work types that sit between CLI and BI.
For most engineering teams, there are three:
-
Operational debugging
Answering: What happened to this user / order / job?
You need:- Fast, safe reads on production (or a read replica).
- A way to follow a story across a few tables.
- A trail you can replay and share.
-
Product & growth questions
Answering: Is this feature behaving as expected? Did this change move the needle?
You need:- Trustworthy aggregates and dimensions.
- A shared language for metrics.
- A path from metric → underlying rows when something looks off.
-
Data modeling & transformation
Shaping: How should raw data be structured so everyone else can use it?
You need:- Versioned transformations in code.
- Tests, documentation, and ownership.
- Predictable, observable runs.
If you design your stack around these three, a simpler picture emerges.
What actually belongs in the middle
Between CLI and BI, you usually need four things — no more, no less:
- A warehouse or database you trust
- A transformation layer in code
- One calm database browser for focused reads
- One BI surface for shared metrics and reporting
Everything else is optional or can be deferred.
Let’s walk through each.
1. A warehouse or database you trust
This is your base. For many teams, it’s already there:
- The primary OLTP database behind your product.
- A read replica of that database.
- Or a warehouse where operational data is regularly synced.
Minimalist questions to ask:
- Can we point a read‑only tool at this without fear?
- Is there a clear separation between “operational” and “analytics” workloads?
- Do we know which database is the source of truth for which questions?
You don’t need a lakehouse to answer most incident tickets. A single, well‑understood database plus a read replica, used with intent, is often enough. Patterns like the one in The Quiet Read-Replica Pattern show how to do this without spawning a second tool explosion.
2. A transformation layer in code
You want your core transformations — the ones that feed BI and recurring analysis — to live in versioned code, not in ad‑hoc SQL buried inside tools.
For many teams, that’s dbt. For others, it’s stored procedures, views, or a homegrown pipeline.
Minimalist stance:
- Start with fewer, higher‑quality models, not a sprawling DAG.
- Model the questions people actually ask: users, subscriptions, orders, events.
- Add tests only where they protect real decisions.
What matters is not which framework you pick, but that:
- Transformations are repeatable.
- They are owned by someone.
- They are transparent enough that engineers can trace a metric back to tables and rows when needed.
3. One calm database browser for focused reads
This is the layer that’s often missing or mis‑shaped.
Most teams default to one of two extremes:
- Raw CLI / SQL IDE – powerful but sharp; great for experts, stressful for everyone else.
- BI tool – great for aggregates and dashboards, clumsy for row‑level debugging.
What’s missing is a middle surface: a calm, opinionated way to read production (or a replica) without:
- Opening a full admin console.
- Dropping into a blank SQL editor.
- Hacking a dashboard into an incident tool.
That’s the space Simpl lives in: a read‑only, opinionated database browser for focused, calm reads. Not an admin panel. Not a full BI suite. Just the right amount of power to:
- Follow one user or entity across a few tables.
- Compare before/after states.
- Leave behind a replayable trail of what you looked at.
If you’ve read posts like From Dashboards to Direct Reads or Less Tabs, More Trails, this is that same idea expressed as a stack decision: one browser is the middle of your stack.
4. One BI surface for shared metrics
Finally, you need a place for:
- Company‑level metrics.
- Product and growth dashboards.
- Self‑serve slicing by non‑engineers.
Pick one BI tool and resist the urge to multiply them. The BI layer should:
- Sit on top of modeled tables, not raw logs.
- Be the canonical view for metrics conversations.
- Offer a clean handoff from “something looks off” → “open the browser and inspect rows.”
That last bit is where the integration with a browser like Simpl matters. The goal is not to answer every question in charts. It’s to make the transition from charts to rows smooth and obvious when you need to see what actually happened.
What you can safely skip or postpone
Given that core, what doesn’t need to sit between your CLI and your BI right away?
Orchestration, if your needs are simple
If you have a handful of daily or hourly transformations, a managed scheduler or even warehouse‑native jobs may be enough.
You probably don’t need:
- A full Airflow or Dagster deployment.
- A custom event‑driven DAG engine.
Until:
- You have dozens of interdependent jobs.
- You need cross‑system coordination.
- Failed runs are common and costly.
Start with the simplest scheduler that can:
- Run your transformations reliably.
- Alert you when they fail.
- Keep a basic history.
Then revisit.
A separate semantic layer
A standalone metrics or semantic layer can be powerful, but it also introduces:
- Another abstraction to learn.
- Another place definitions can drift.
For many teams, a well‑structured dbt project plus BI tool is enough:
- Define metrics in code (dbt models, views, or metric configs).
- Expose them cleanly in BI.
- Document them alongside the models.
Add a dedicated semantic layer only when:
- You have multiple BI tools that must share one definition of metrics.
- You’re hitting real limits in how your BI tool models dimensions and measures.
Heavyweight catalogs and lineage tools
Data catalogs and lineage graphs help at scale, but they also demand ongoing curation.
In a minimalist stack, you can often get far with:
- Clear naming conventions.
- dbt docs or equivalent.
- A small, human‑maintained “query library” of trusted investigations and trails.
That last piece is where Simpl and patterns like From Query Zoo to Query Library matter more than a global lineage graph. You don’t need to see every edge in your system; you need a few blessed paths that reliably answer recurring questions.
Notebook sprawl
Notebooks are great for exploration and analysis. They’re not great as your default interface to production.
If every incident quietly turns into a notebook session, you get:
- Private, unreviewed queries.
- Mixed concerns (debugging + experimentation).
- No clear trail others can follow.
A minimalist stance:
- Use notebooks for analysis and exploration on safe data.
- Use a focused browser like Simpl for production reads and incidents.
- Promote only the stable, reusable parts of notebook work into code or shared trails.
Designing your own minimalist middle
How do you move from a noisy stack to a calmer, thinner one?
Here’s a practical, opinionated path.
Step 1: Map real questions, not tools
For two weeks, capture the actual questions people ask of your data:
- “What happened to this user’s subscription last night?”
- “Did this migration touch tenant X?”
- “Why did this metric drop yesterday?”
For each question, note:
- Which tools were opened.
- Which queries were run.
- Where the final answer lived.
You’ll likely see patterns:
- The same 10–20 questions repeating.
- The same tables and joins appearing.
- The same awkward hops between dashboards, SQL IDEs, and ad‑hoc consoles.
Step 2: Choose one browser as the default read surface
Pick a single tool to be the place you open when you need to look at rows.
If you’re using Simpl, that means:
- Pointing it at production or a read replica.
- Locking it to read‑only access (see also: Opinionated Read-Only by Design).
- Encouraging engineers to start there before dropping into raw CLI or BI.
The important part is cultural:
- Incidents start in the same browser.
- Debug sessions leave behind trails others can replay.
- You reduce the number of tools people feel obligated to open “just in case.”
Step 3: Turn recurring questions into shared trails
For each recurring question from Step 1, create a reusable read path:
- A saved query chain or “trail” in your browser.
- A short description of when to use it.
- Links from relevant runbooks or docs.
Over time, this becomes your query library: a small set of trusted paths instead of a zoo of ad‑hoc SQL. The post From Query Zoo to Query Library goes deeper on this pattern.
Step 4: Align transformations with those trails
Look at your transformation layer (dbt or otherwise) and ask:
- Do our models reflect the questions we actually ask?
- Are we modeling entities (users, subscriptions, orders) in a way that makes trails simpler?
If not, refactor toward:
- Fewer, more meaningful models.
- Clear, documented joins between them.
- Tests that match real failure modes (e.g., “subscriptions without users”).
The goal is that the path from metric → model → rows is short and legible.
Step 5: Simplify everything else
With a strong middle browser and a lean transformation layer, you can start asking hard questions about the rest of your stack:
- Do we really need two BI tools?
- Can we retire this internal admin console in favor of a read‑only browser plus a separate, audited write path?
- Are there notebooks or custom UIs that can be replaced by a focused browser session?
The answer won’t always be “yes,” but even a 20–30% reduction in surfaces can dramatically lower cognitive load. Posts like Guardrails in the Flow, Not the Setup and Quiet Defaults in the Browser outline how to make that browser feel safe enough to replace some of the scattered tooling.

The benefits of a thinner stack
When you reduce the layers between CLI and BI to the essentials, a few things happen:
-
Incidents get shorter.
There’s a single, trusted path from alert → browser → rows → decision. -
Risk feels lower.
A read‑only browser like Simpl makes opening production data feel routine, not dangerous. -
Onboarding gets easier.
New engineers learn one browser and a handful of trails, not a constellation of tools. -
Metrics conversations improve.
When numbers look off in BI, there’s a clear way to drill into the underlying story without inventing a new workflow. -
Less “human middleware.”
People stop acting as the glue between disconnected tools. The stack itself carries more of the workflow.
Most importantly: the work of understanding your data starts to feel like reading a story, not fighting a maze.
A calm first step
You don’t have to redesign your entire stack to get these benefits.
Start with one move:
- Pick one database browser to be your default read surface.
- Point it at the database that holds your most important stories.
- Run your next few incidents and investigations entirely inside that browser, capturing the trails you follow.
If you want that browser to be opinionated, read‑only, and built for this exact middle layer, try Simpl.
From there, you can grow a minimalist data stack outward — not by adding more tools, but by letting a few, well‑chosen layers do their work quietly.