The Quiet Chronology: Replaying an Incident from Logs to Rows Without Opening Ten Tools

Incidents don’t happen in charts. They happen along a timeline.
A request comes in. A feature flag flips. A background job runs. A query times out. A retry kicks in. Somewhere along that path, a real customer gets stuck.
You already have the evidence:
- Application logs
- Traces and metrics
- Database rows
But during an incident, that evidence is scattered across tools. You jump from:
- Log viewer
- APM traces
- Metrics dashboards
- Admin console
- SQL IDE
- BI tool
Each one has a piece of the story. None of them holds the story.
This post is about a quieter alternative: treating incident investigation as a single chronology you can replay—end to end—from logs to rows, without opening ten tools or rewriting the same ad‑hoc queries every time.
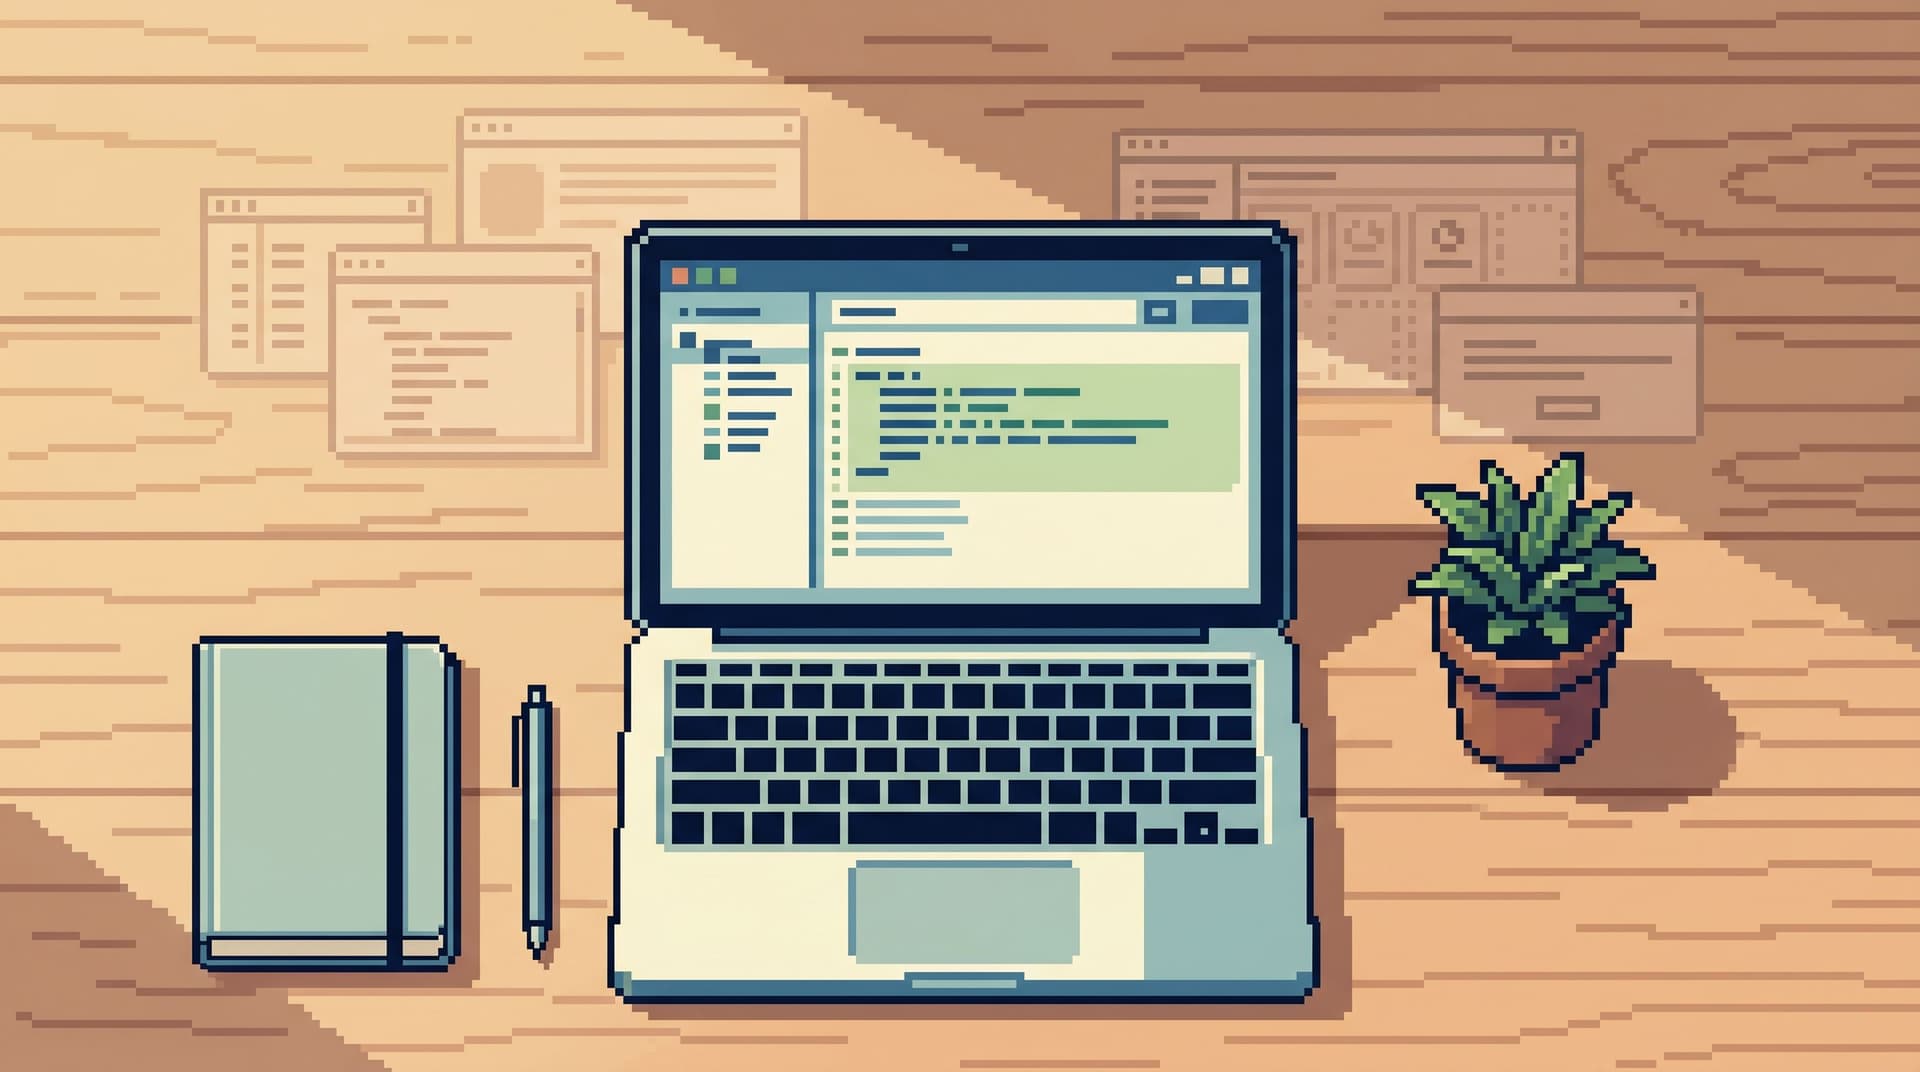
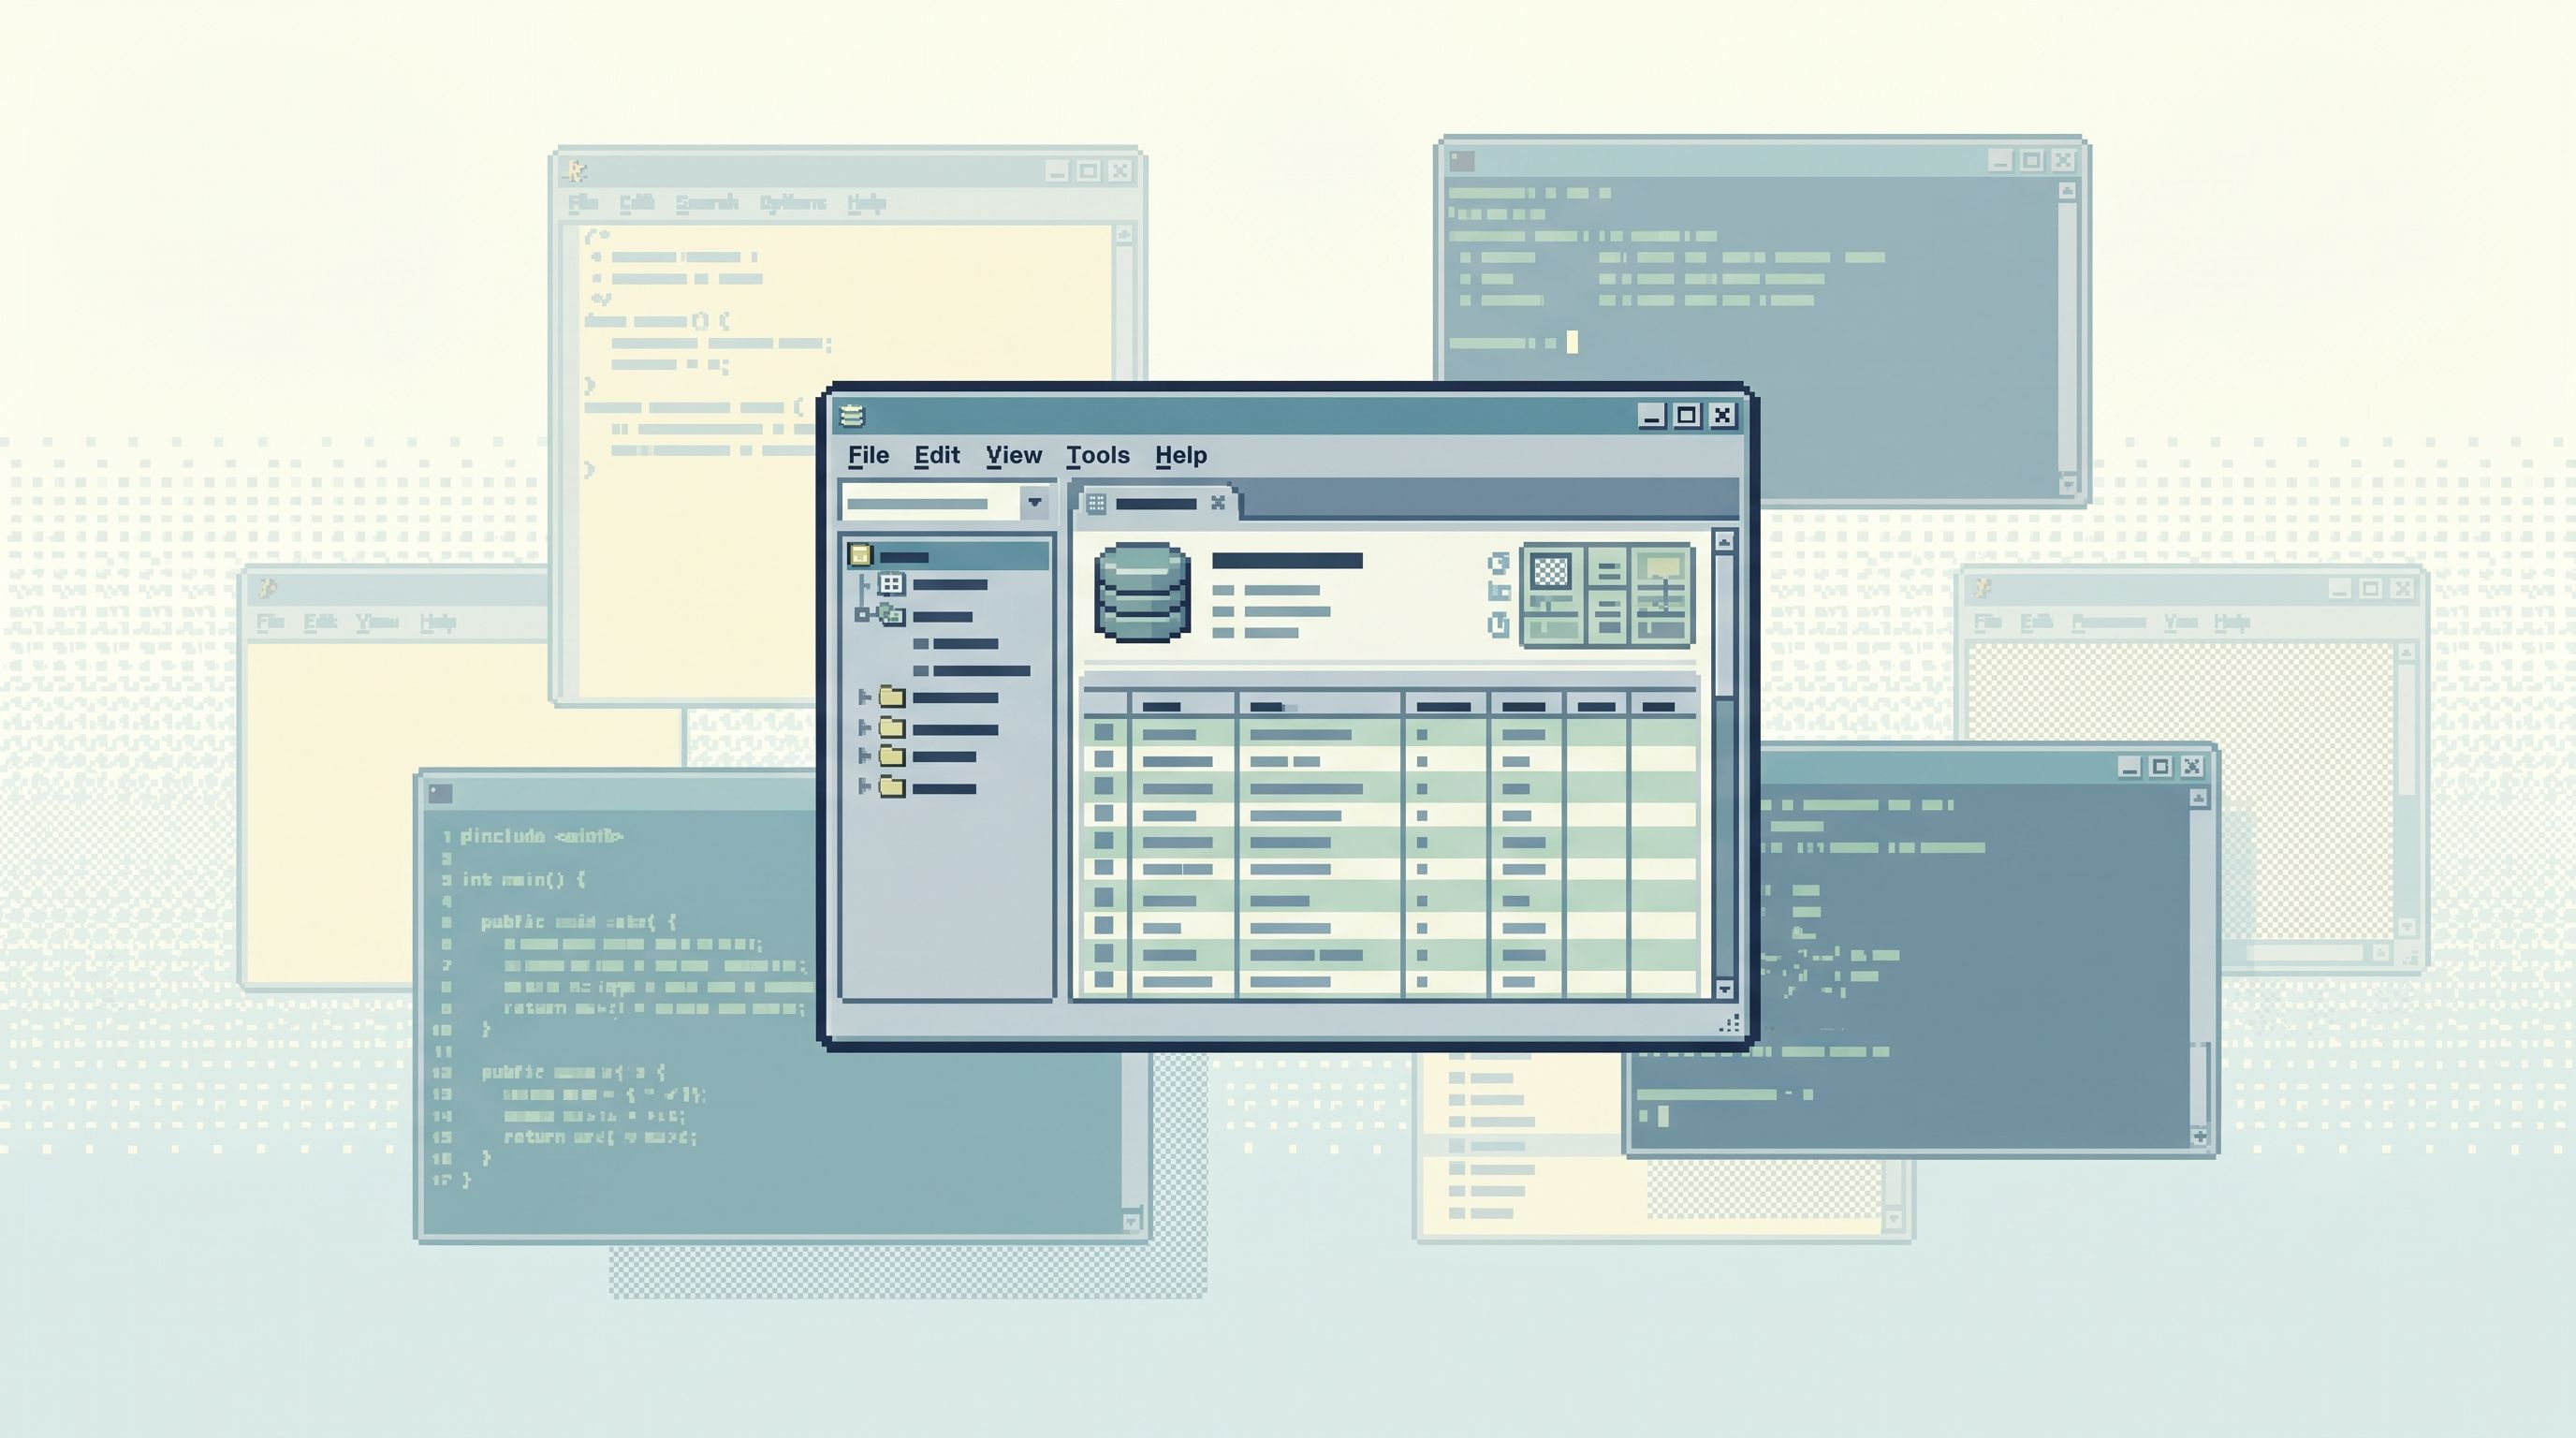
A tool like Simpl is built for this middle layer: a calm, opinionated database browser that lets you move from events to rows in a straight line, instead of a tab explosion.
Why chronology matters more than coverage
Most teams already have “coverage”:
- Logs for every service
- Metrics for every node
- Dashboards for every function
- Admin access for every database
Coverage is not the problem. The problem is sequence.
During an incident, you’re trying to answer three very specific questions:
- What exactly happened, and when?
- Which concrete entities were involved? (user, order, job, payment)
- What changed between “working” and “broken”?
That’s chronology work. It’s about:
- Pinning a time window
- Following one request or entity through multiple systems
- Landing in the exact rows that prove your hypothesis
When you don’t have a clear chronology, you see familiar failure modes:
- People screenshot logs instead of sharing links
- Different folks investigate different time windows
- The same query gets rewritten five times
- No one is sure which rows are “the” rows for the incident
You don’t need more data. You need a deliberate path from event → context → rows.
For more on why a single entry point matters, see The Calm Query Session: Designing Database Work Around One Entry Point, Not Ten.
The noisy default: incident archaeology by tab
A typical incident replay looks like this:
-
Start in logs
- Filter by error code or log level
- Narrow down to a rough time window
- Grab a request ID or user ID
-
Hop to metrics or dashboards
- Confirm this wasn’t a one‑off
- Check if other services spiked
-
Open an admin console or SQL IDE
- Manually look up the user, order, or job
- Try a few queries
- Add more filters as you learn
-
Repeat across services
- New logs, new IDs, new queries
Along the way you accumulate:
- 10+ browser tabs
- 3–4 different query editors
- A Slack thread full of screenshots and half‑baked hypotheses
The cost isn’t just stress. It’s structure:
- There is no single place that holds the “movie” of what happened
- If you revisit the incident next week, you’re basically starting over
- New team members can’t follow the path without live hand‑holding
The goal is not to eliminate tools. It’s to make one path through them feel obvious and repeatable.
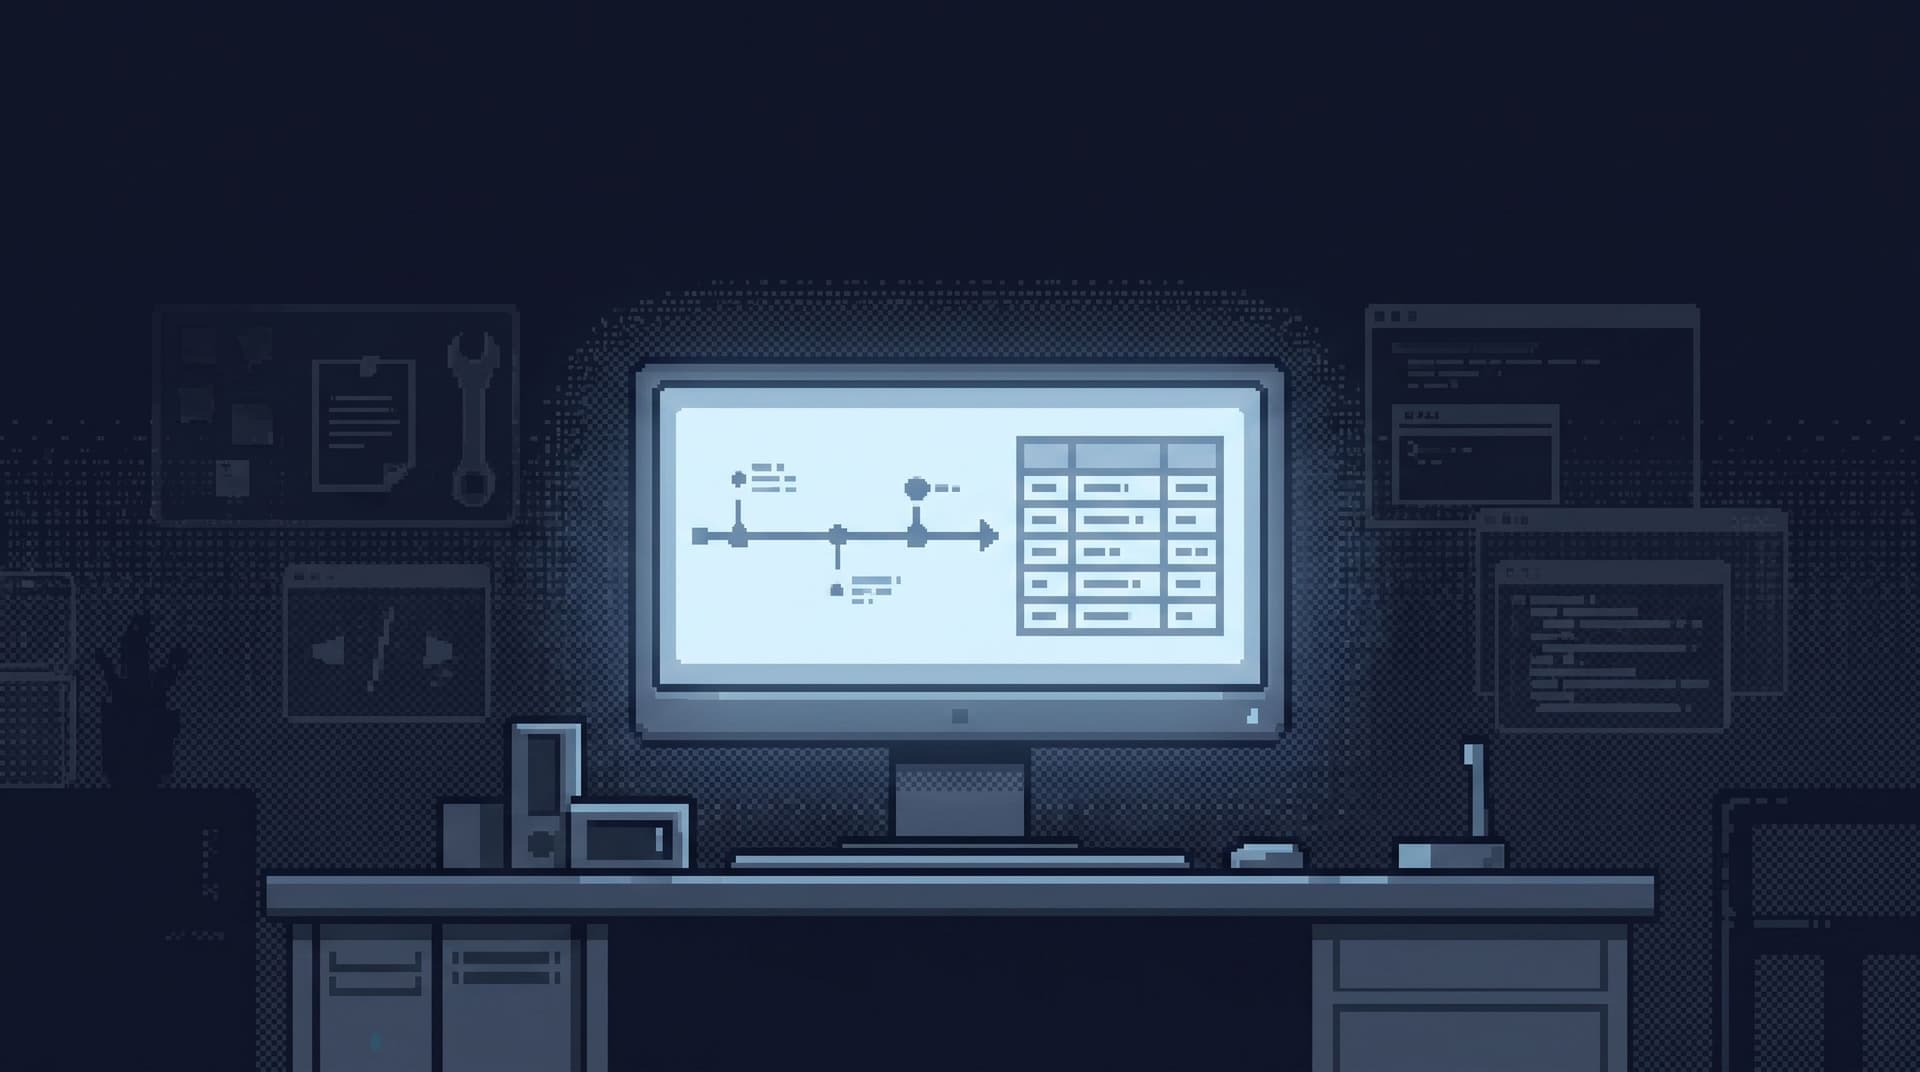
A quieter goal: one straight line from log to row
A calm incident replay has a different shape:
- You start from a concrete event (log line, trace, alert).
- That event carries a small set of stable identifiers.
- You follow those identifiers into a single, opinionated database browser.
- You walk a short, predictable trail of focused reads that line up with the incident timeline.
Instead of exploring everything, you:
- Decide which identifiers matter
- Decide which tables and views matter
- Encode those decisions once
- Reuse them every time a similar incident shows up
This is the same stance behind The Quiet Query Template: Turning Recurring Debug Flows into Opinionated, One-Click Reads: treat your recurring incident paths as first‑class, not as ad‑hoc SQL.
Step 1: Decide what “replay” means for your system
“Replay the incident” is vague. Make it concrete.
For your product, what does a typical incident actually involve?
Examples:
- Checkout failures → user, cart, payment attempt, order
- Background job stuck → job ID, batch ID, affected records
- Feature flag bug → user, flag assignment, experiment variant, downstream writes
For one high‑value incident type, write down:
-
Primary entity
- The thing your support or product team names first
- e.g.,
user_id,order_id,job_id
-
Key milestones in the timeline
- When was it created?
- When did it change state?
- Which downstream actions should have happened?
-
Tables (or services) that hold each milestone
orders,payments,shipmentsjobs,job_executions,job_logs
You’re building a narrative skeleton: a minimal sequence of states that, if you can see them, tells you the story of the incident.
That skeleton will drive how you structure both logs and database reads.
Step 2: Put identifiers at the center of your logging
You can’t replay what you didn’t record.
If you want a quiet chronology, your logs need to carry:
- Stable identifiers that exist in the database
- Consistent field names across services
- Timestamps that are easy to align
Concretely:
- Pick 1–2 canonical identifiers per incident type (e.g.,
user_id,order_id) - Make them mandatory in:
- HTTP request logs
- Background job logs
- Domain event logs
- Use the same keys everywhere (
user_id, notuidin one place anduserIdin another)
This is what makes it possible to:
- Grab a single log line
- Extract a single ID
- Walk that ID into your database browser without guesswork
You don’t need perfect distributed tracing. You need traceable IDs that match your rows.
Step 3: Choose one calm entry point into your data
Once you have identifiers, you need a single place to use them.
That place should:
- Be read‑first and opinionated, not a root‑level admin console
- Make it easy to land on the right tables for a given ID
- Encourage small, focused queries, not
SELECT *explorations
A focused database browser like Simpl is designed for exactly this middle layer:
- Post‑logs, pre‑admin
- Post‑dashboards, pre‑CLI
- One place where incident reads actually happen
If you’re still bouncing between BI, admin consoles, and local IDEs, you’re fighting your own tool stack. You can see how this middle layer fits in more detail in Post-Admin, Pre-CLI: Where a Focused Database Browser Actually Fits in Your Stack.
The key move: pick one entry point and commit to it for incident reads.
Step 4: Turn your replay into a short trail of reads
Now you have:
- Logs with stable identifiers
- A chosen entry point into your database
The next step is to encode the chronology itself as a small set of opinionated reads.
Pick one incident type and design a 3–5 step trail.
Example: Failed checkout
-
User snapshot
- Query: select key attributes for
user_id - Purpose: confirm who we’re dealing with, feature flags, risk flags
- Query: select key attributes for
-
Order timeline
- Query: all orders for that
user_idin the relevant time window, ordered bycreated_at - Purpose: see if this is a one‑off or part of a pattern
- Query: all orders for that
-
Payment attempts
- Query: all payment attempts for the failing
order_id, with status and error codes - Purpose: see retries, gateway responses, and failure reasons
- Query: all payment attempts for the failing
-
Downstream effects
- Query: shipments, credits, or notifications linked to the same
order_id - Purpose: understand what did or didn’t fan out
- Query: shipments, credits, or notifications linked to the same
Each step is:
- Read‑only
- Scoped by the same identifiers you log
- Sorted and filtered to match how incidents actually unfold
In a browser like Simpl, you’d save these as:
- Named, parameterized views
- Linked trails where one read flows into the next
The important part is not the tool. It’s the shape:
- Few steps
- Clear intent per step
- Shared across the team
Step 5: Wire logs to trails, not to blank editors
Most teams stop at: “We have good logs and good queries.”
The real leverage comes when you connect them.
For your main incident types, aim for this experience:
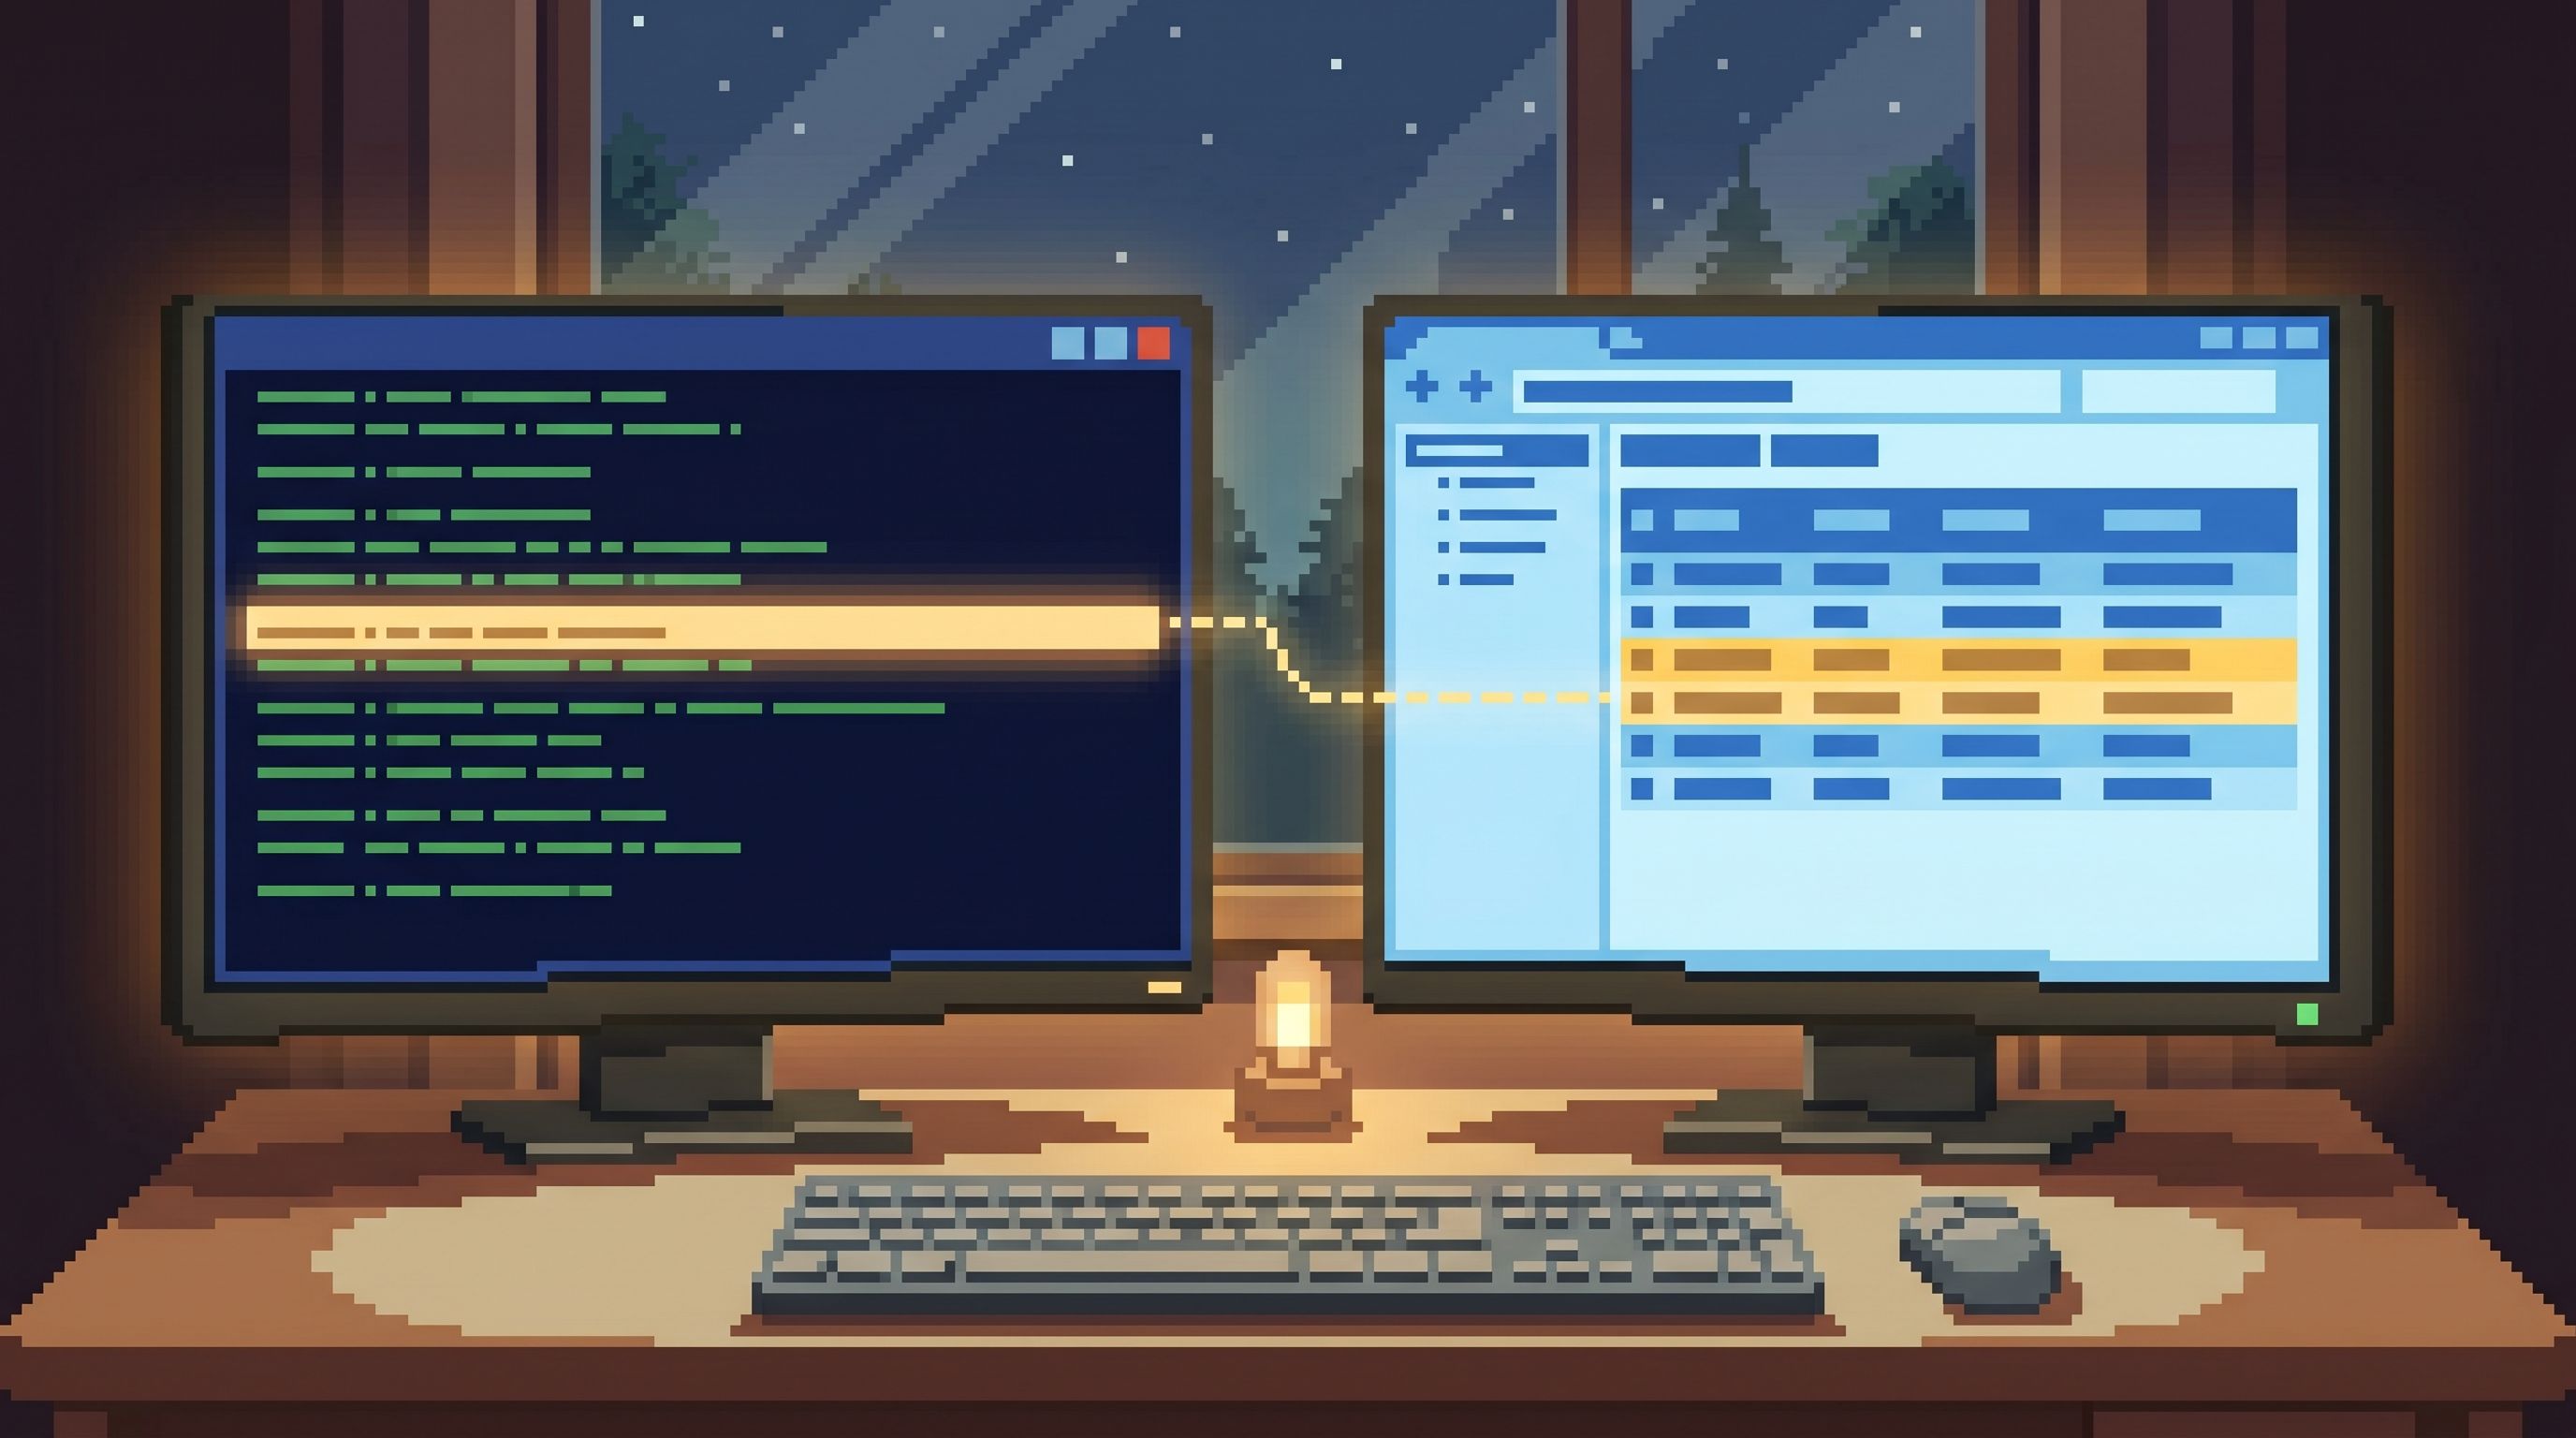
- You click from a log line (in your log viewer) straight into your database browser.
- The URL includes the primary identifier (e.g.,
user_id=123ororder_id=456). - The browser opens directly on the first step of your trail, already filtered.
You can do this with:
- Simple URL templates in your log viewer that link out to your browser
- Parameterized views in your browser that accept
?user_id=or?order_id=
The effect is subtle but powerful:
- No one starts from a blank SQL editor under pressure
- Every incident walk begins with the same, opinionated first read
- People naturally follow the same chronology instead of inventing new ones
You’ve effectively turned your logs into entry points, not just evidence.
Step 6: Capture the chronology as part of the incident, not as an afterthought
A quiet chronology isn’t just for the people on the call. It’s for:
- Future incidents
- Post‑incident reviews
- New team members
Once you have a stable trail, make it part of how you “finish” an incident:
- Paste links to each step of the trail into the incident ticket
- Note which reads confirmed or disproved a hypothesis
- Record the final set of rows that represent the root cause
Over time, you build a library of:
- “For this class of incident, we always walk these 3–4 reads.”
- “This extra read turned out to be useful; we added it to the trail.”
This is how you avoid the graveyard of random saved queries and move toward what Beyond Saved Views: Turning Common Production Reads into Opinionated ‘Runbooks in SQL’ describes: a small, curated set of incident runbooks expressed as SQL trails.
What this buys you during real incidents
When you invest in a quiet chronology, incidents change character.
1. Faster alignment
Everyone follows the same path:
- Same identifiers
- Same starting read
- Same sequence of checks
You spend less time arguing about where to look and more time interpreting what you see.
2. Less tool‑induced stress
You still have logs, metrics, and dashboards. But you’re not:
- Alt‑tabbing between five consoles
- Re‑authenticating into admin tools mid‑incident
- Copy‑pasting SQL into Slack for others to re‑run
Most of the work happens in one calm browser, with links you can safely share.
3. Safer, more repeatable queries
Because your trails are:
- Read‑only
- Parameterized by a small set of IDs
- Designed around narrow time windows
…it becomes easier to let more engineers participate in incident reads without risking production stability.
4. Better handoffs and reviews
The “movie” of the incident is:
- A log link with the key identifiers
- A small set of browser links for each step of the trail
- A final set of rows that tell the story
You can revisit that movie later without reconstructing anything from memory.
Start small: one incident, one trail, one entry point
You don’t need to redesign your entire observability stack to get value from this.
Pick a single, painful incident type. For that one path:
- Name the primary identifier.
user_id,order_id,job_id—be explicit.
- Standardize it in logs.
- Same key name, present in all relevant services.
- Choose one browser as the entry point.
- A focused tool like Simpl works well here.
- Design a 3–5 step read trail.
- From “who is this?” to “what exactly went wrong?”
- Wire your log viewer to the first step.
- URL templates, parameters, no blank editors.
Run your next incident along that path. Notice:
- How many fewer tools you actually need
- How much easier it is to keep everyone on the same page
- How much clearer the final story feels
Then, and only then, replicate the pattern to your next incident type.
Summary
Replaying an incident doesn’t have to mean bouncing between ten tools.
If you:
- Treat incidents as chronologies, not just spikes
- Put stable identifiers at the center of your logs
- Choose one calm entry point into your data
- Encode your incident flow as a short, opinionated trail of reads
- Wire your logs directly into that trail
…you get a quiet, repeatable way to move from logs to rows. Incidents feel less like archaeology and more like reading a story you already know how to follow.
A focused browser like Simpl exists for exactly this middle layer: not to replace your logs or your dashboards, but to give you one clear place where the incident’s chronology becomes visible in real rows.
Take the first step
You don’t need a new platform rollout to get started.
This week, pick one recurring incident type and do three things:
- Write down the minimal chronology you care about: the entities and milestones.
- Standardize one identifier in your logs so you can reliably grab it.
- Set up a single, read‑only trail in your database browser that starts from that identifier.
Run the next incident through that path. Notice how it feels.
If you want a tool that’s built around this kind of quiet chronology—logs to rows, without ten competing entry points—take a look at Simpl. It’s an opinionated database browser designed to make incident replays feel calm, not heroic.