The Minimalist’s Guide to Database Debugging in Incident Response


Incidents are loud.
Alerts fire. Channels light up. People pile into a call. Everyone is scrolling, querying, refreshing, speculating.
The database sits in the middle of it all—usually as a blur of dashboards, ad-hoc queries, and half-remembered table names.
This is where debugging often goes wrong. Not because the problem is unsolvable, but because the approach is noisy.
A minimalist approach to database debugging doesn’t mean doing less. It means doing only what matters, in a deliberate order, with tools that don’t compete for your attention.
This post is about how to do that when the pager goes off.
Why database debugging feels chaotic
Most incident calls follow a familiar pattern:
- Someone opens a full-featured SQL client or admin console
- A dozen queries get written in parallel
- Dashboards are checked “just in case”
- People chase symptoms instead of constraints
The result:
- Slow time-to-understanding – You spend 20–40 minutes just figuring out what’s actually broken.
- Conflicting narratives – Different people stare at different slices of data and come to different conclusions.
- Risky improvisation – Under pressure, someone runs a mutation query they wouldn’t normally run.
We’ve written before about how tools that behave like IDEs push you toward constant typing and experimentation instead of calm inspection: see Why Your Database GUI Feels Like an IDE (and Why That’s a Problem).
Incident response amplifies all of those habits.
A minimalist approach asks a different question:
What is the smallest set of queries and checks we can run to reliably understand and contain this incident?
Principles of minimalist database debugging
Before we get tactical, it helps to anchor on a few principles:
-
Read before you write
In an incident, your default posture should be: observe first, mutate only when you have a clear, shared model. This mirrors the idea of a read-first database workflow. -
Narrow the surface area
You don’t need every table, every metric, or every dashboard. You need the 2–5 data sources that actually constrain the system’s behavior. -
Make state visible, not clever
Debugging is about making reality obvious, not about writing elegant SQL. Favor simple, explicit queries you can read aloud. -
Prefer repeatable flows over hero queries
If every incident depends on whoever “remembers the right query,” you don’t have a system—you have folklore. Minimalism means reusing known checks before inventing new ones. -
Use tools that stay out of the way
The more your interface looks like a code editor, the more it will tempt you to experiment under pressure. An opinionated browser like Simpl is intentionally biased toward calm inspection instead of frantic editing.
A minimal incident debugging flow
Here’s a concrete, stepwise flow you can use when an incident likely involves the database.
It’s not exhaustive. It’s the shortest reliable path from alert to understanding.
1. Name the suspected failure mode
Before touching the database, write one sentence:
“We think this is a problem with X because we’re seeing Y from Z.”
Examples:
- “We think this is a stuck background job because new orders are not moving to
paidstate, and the job queue depth is growing.” - “We think this is a data skew / hotspot because 90% of requests are timing out on one tenant, but others are fine.”
Why this matters:
- It forces you to anchor on a hypothesis, not a vibe.
- It narrows which tables and queries you should look at first.
If you can’t write that sentence, you’re not ready for the database yet. Get more signals from logs, metrics, or application traces first.
2. Identify the 1–3 critical tables
For most incidents, only a few tables truly matter. Ask:
- Which tables represent the core entities in this incident? (orders, payments, jobs, sessions…)
- Which tables are most likely to show the broken state? (dead letters, error logs, audit tables…)
Make a short list:
- Primary table:
orders - Secondary:
payments,order_events
That’s your working set.
If you use a browser like Simpl, this is where you pin those tables, so everyone is literally looking at the same objects.
3. Run the three baseline checks
Before writing custom queries, run the same three checks every time:
-
Volume & recency
- Are rows still being inserted into the primary table?
- What’s the count of rows created in the last 5, 15, 60 minutes vs. a normal period?
Example:
SELECT date_trunc('minute', created_at) AS minute, count(*) FROM orders WHERE created_at >= now() - interval '60 minutes' GROUP BY 1 ORDER BY 1; -
State distribution
- How are rows distributed across key status columns?
- Are they piling up in an intermediate state?
SELECT status, count(*) FROM orders WHERE created_at >= now() - interval '60 minutes' GROUP BY status ORDER BY count(*) DESC; -
Error markers
- Is there an
error_code,failed_at, or similar column that suddenly spiked? - Are there obvious “poisoned” rows (e.g.,
retry_count > 10)?
SELECT error_code, count(*) FROM payments WHERE created_at >= now() - interval '60 minutes' GROUP BY error_code ORDER BY count(*) DESC; - Is there an
These three checks answer:
- Is data still flowing?
- Where is it getting stuck?
- What shape does the failure take?
They’re simple on purpose. You should be able to run them in under 5 minutes and explain them to anyone on the call.
If your team doesn’t already have these saved as reusable views, that’s a good candidate for systematizing—see From Ad-Hoc Queries to Repeatable Flows: Systematizing How Your Team Looks at Data.
4. Trace one real example end-to-end
Once you know where things are piling up, pick one concrete object and trace it through the system.
For example, if orders are stuck in pending_payment:
-
Pick a recent
order_idin that state. -
Find the related payment row(s).
SELECT * FROM payments WHERE order_id = 'order_123'; -
Look at events or logs tied to that order.
SELECT * FROM order_events WHERE order_id = 'order_123' ORDER BY created_at; -
Compare this broken example with a known-good example from earlier in the day.
You’re looking for differences in state transitions, not just raw errors:
- Missing event?
- Extra event?
- Same event but in the wrong order?
- Same events but timestamps far apart?
Minimalism here means:
- One object at a time
- One table at a time
- No clever joins until you know what you’re trying to prove
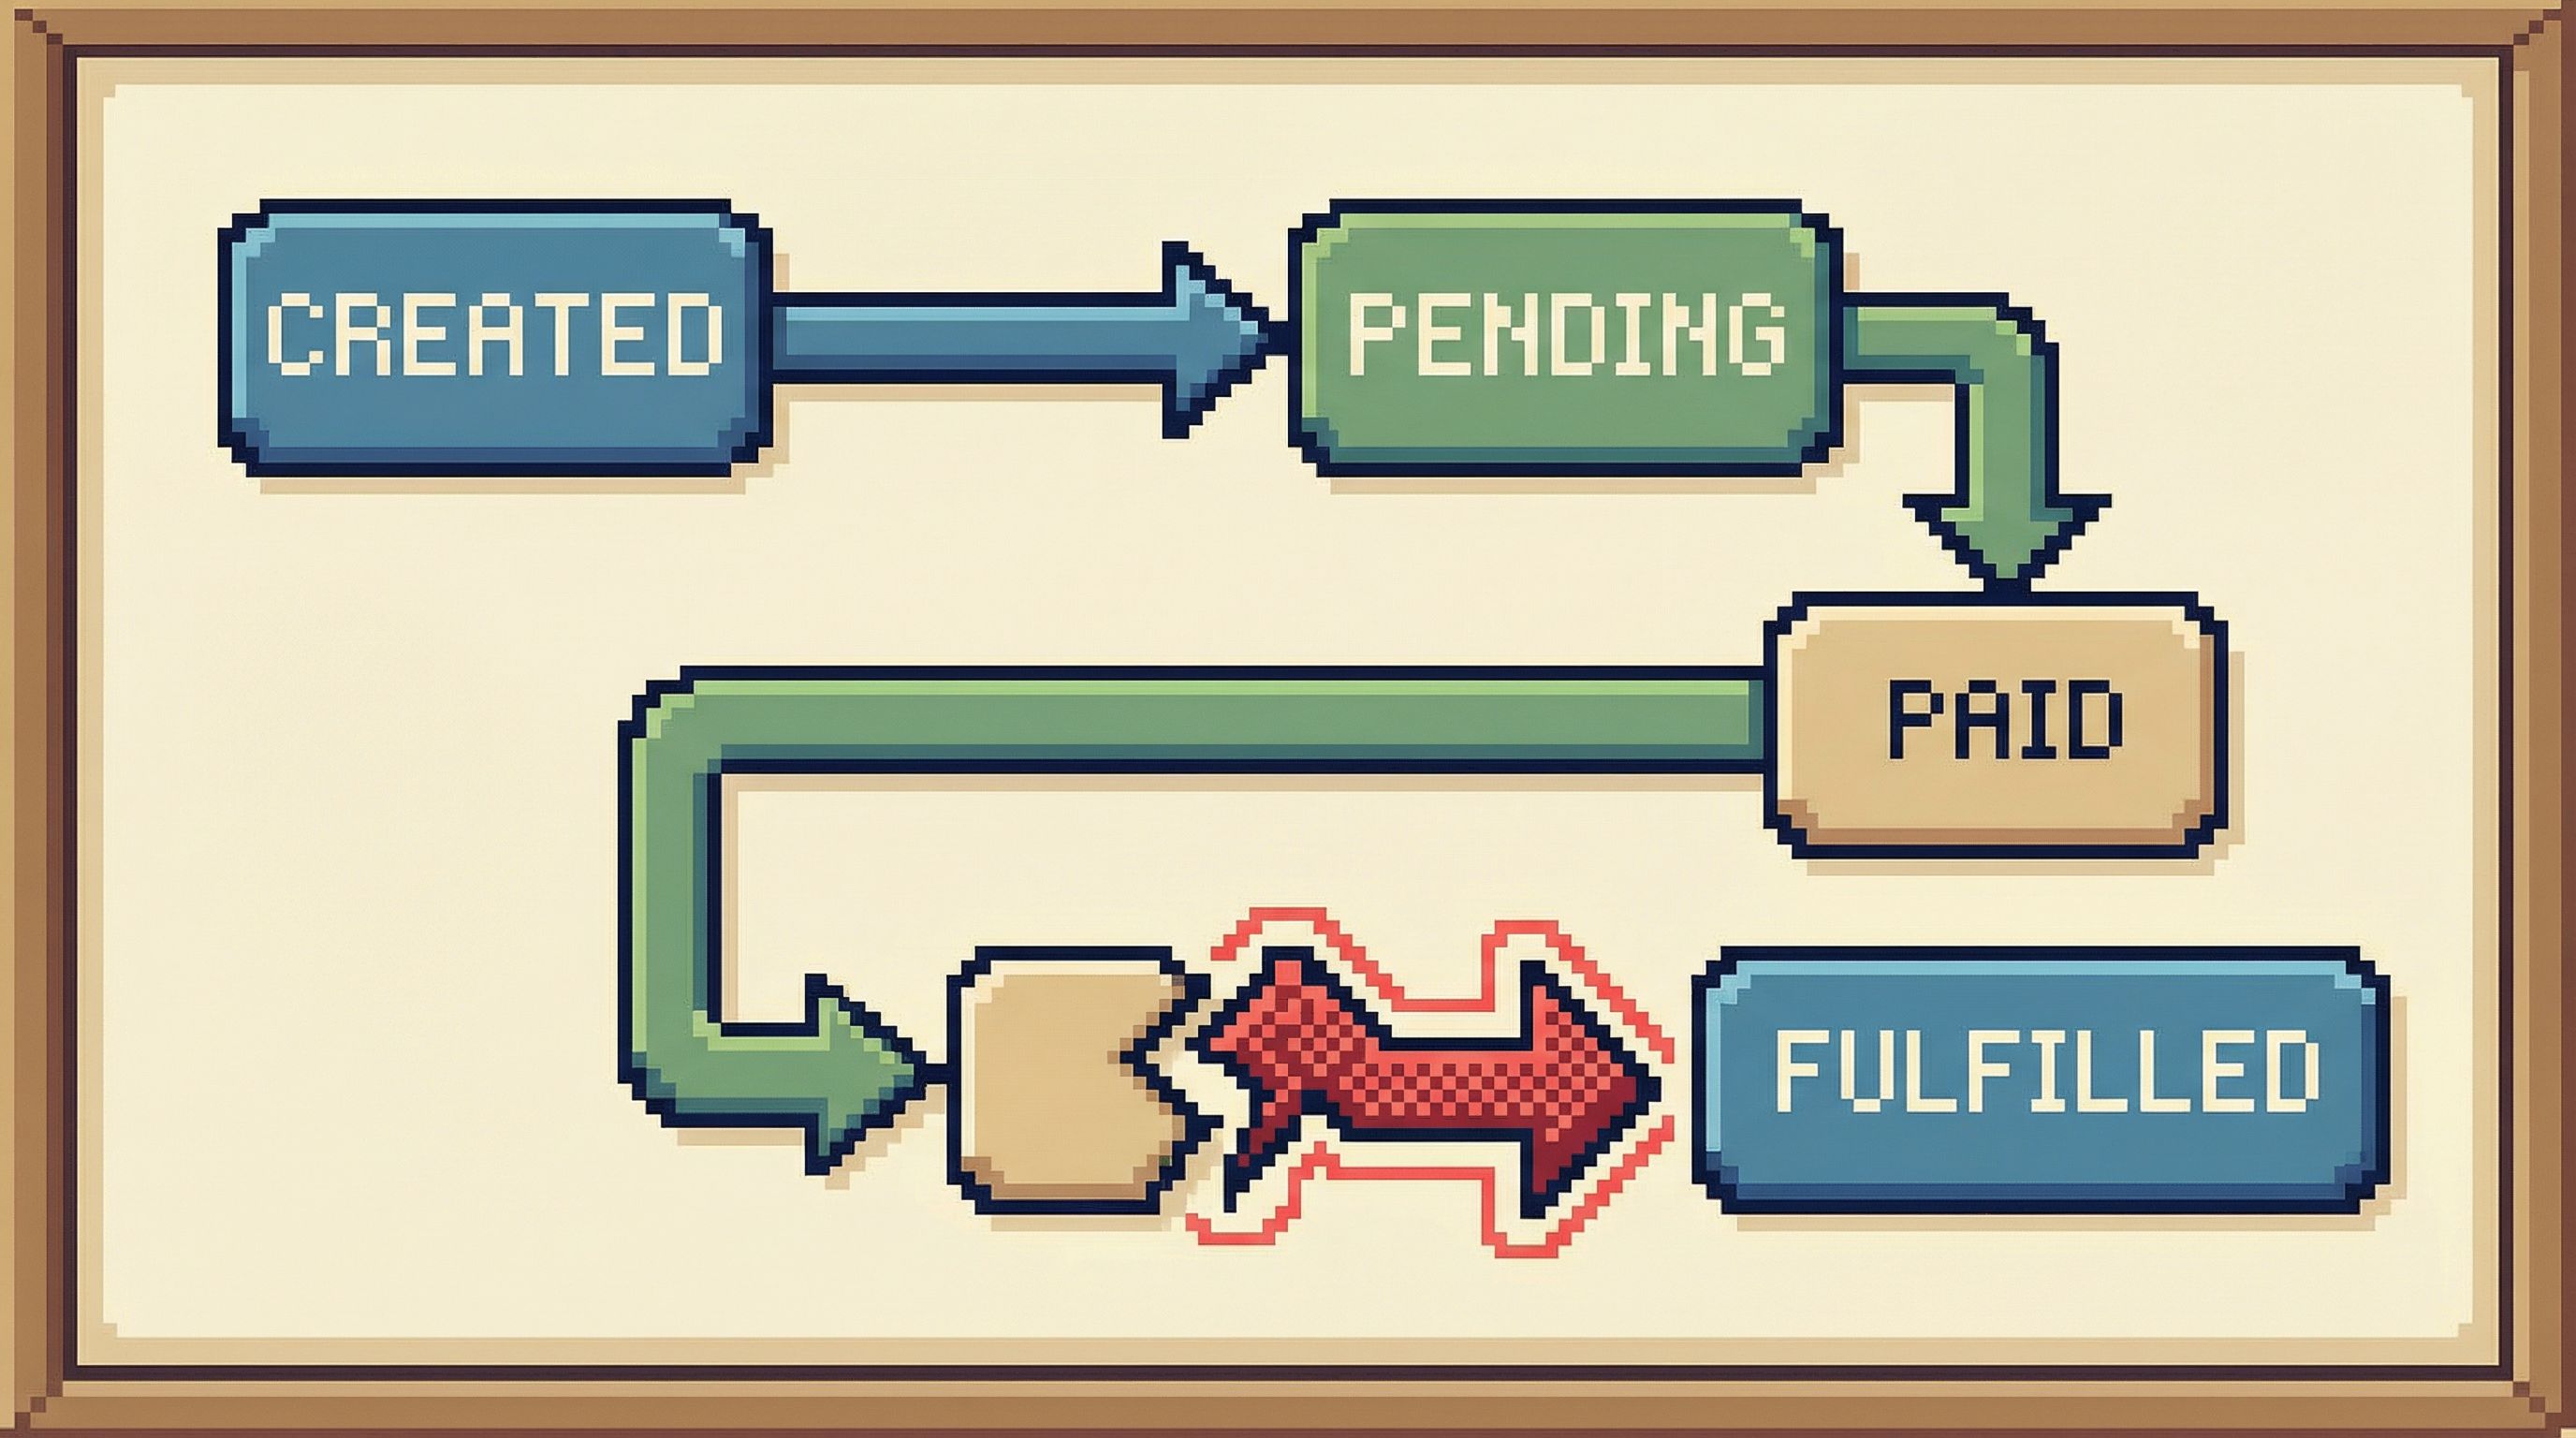
5. Draw the smallest possible state diagram
On a shared doc or whiteboard, sketch the state transitions that matter for this incident.
Example for payment-related outages:
created → pending_payment → paid → fulfilled
Add only what you see in the data:
- States (from
statuscolumns) - Transitions (from
order_eventsorupdated_atchanges) - Where the broken examples diverge from the healthy ones
This gives you a visual map of the problem:
- “Healthy orders reach
paidwithin 2 minutes.” - “Broken orders never emit a
payment_succeededevent.” - “All broken orders share
payment_provider = 'X'.”
Once you have this, queries become much more targeted:
-
“Show me all orders that reached
pending_paymentbut neverpaidin the last hour.”SELECT o.id FROM orders o LEFT JOIN order_events e_paid ON e_paid.order_id = o.id AND e_paid.type = 'payment_succeeded' WHERE o.status = 'pending_payment' AND o.created_at >= now() - interval '60 minutes' AND e_paid.id IS NULL;
This is still minimalist: one well-aimed query informed by an explicit model.
6. Decide on the smallest safe intervention
At some point, you’ll need to act.
Minimalist debugging doesn’t mean you never write to the database. It means you:
- Act later in the process, once the model is clear
- Act in the smallest possible scope
- Act with reversibility in mind
Before running any mutation query, answer together:
- What exact set of rows will this touch? (Can we list them explicitly?)
- What state are they in right now?
- How will we confirm the change had the intended effect?
- How will we undo or mitigate if we’re wrong?
Examples of minimal interventions:
- Flipping a small batch of stuck jobs from
errortopendingfor reprocessing, after verifying they share the same benign error. - Backfilling a missing event for a limited set of orders identified by a precise query.
- Temporarily disabling a problematic consumer that is making things worse, while you drain the queue.
This is where guardrails matter. If your production access model forces people into raw superuser consoles, you’re more likely to see risky improvisation. We explored quieter alternatives in Production Data Without Pager Anxiety: Guardrails That Actually Get Used.
A tool like Simpl can help by:
- Biasing toward read-only views by default
- Making the scope of any mutation extremely explicit
- Encouraging teams to store and reuse vetted “fix-up” flows
7. Capture the flow, not just the fix
After the incident, most teams write a postmortem that focuses on:
- Root cause
- Timeline
- Fix
What’s usually missing is the debugging flow:
- Which tables did we inspect first?
- Which queries actually helped?
- Which signals turned out to be noise?
Minimalist teams treat this as reusable infrastructure. After the call, they:
- Save the baseline checks as named queries or views
- Document the 2–3 most useful “slicing” queries (e.g., “orders stuck between states”) in a shared place
- Trim away the dead ends so next time starts from a calmer baseline
Over time, this turns incident response from improvisation into a set of lightweight, repeatable flows. Your future self will thank you.
Making minimalism real in your tools
You don’t have to redesign your entire stack to work this way, but a few choices go a long way:
Prefer read-first interfaces
Choose tools that:
- Open in table views, not blank editors
- Make record-level inspection easy
- Treat mutations as explicit, higher-friction actions
Query Fast, Think Slow: Designing Database Tools for Deliberate Work goes deeper on this idea.
Simpl is built around this bias: an opinionated database browser that puts calm inspection ahead of clever editing, so incident calls don’t devolve into SQL theater.
Standardize a small set of incident views
For each critical domain (billing, auth, jobs, orders), define:
- 2–3 baseline “health” views (volume, state distribution, error markers)
- 1–2 “stuck object” views (things that entered a state but never progressed)
Store them as:
- Saved queries in your database browser
- Read-only dashboards that link back to the underlying tables
The goal is not a full BI layer. It’s a minimal shelf of known-good entry points.
Keep the noise out
During incidents, enforce a few simple norms:
- One person drives the database exploration and narrates what they’re doing
- Others propose queries or questions in chat; the driver runs and summarizes
- Screenshare from a single, calm interface, not a cascade of windows
Minimalism is as much social as it is technical.
Summary
Database debugging during incidents doesn’t have to be chaotic. A minimalist approach focuses on:
- Clear hypotheses before touching the database
- A tiny set of critical tables instead of the whole schema
- Three baseline checks (volume, state distribution, error markers) as a starting ritual
- End-to-end tracing of one real example to understand state transitions
- Small, reversible interventions only after the model is clear
- Capturing the flow so the next incident starts from a calmer baseline
With the right habits and tools, your database can become a quiet source of truth during incidents, not another source of noise.
Take the first step
You don’t need a new incident to start.
Pick one domain—orders, billing, jobs—and:
- Define the 1–3 tables that matter most.
- Create the three baseline checks as saved queries.
- Run them once a day for a week, just to see what “normal” looks like.
If you want a tool that nudges you toward this calmer way of working, try exploring your production data with Simpl. Start with read-only views, build a small library of incident-ready checks, and let your next pager moment feel a little less noisy.